Economic and Societal Impact Of Motor Vehicle Crashes, 2015
A Note on the 2015 Revision
The Economic and Societal Impact of Motor Vehicle Crashes was originally published in May 2014. Subsequent to its publication, a coding error was discovered in the SAS program that was used to aggregate costs to persons with multiple injuries. This error impacted estimates of medical care costs, lost work and household productivity, and insurance administrative and legal costs. After evaluating the potential impact of this error, the authors determined that it was large enough to warrant a revision to the base report. This revised report thus replaces the May 2014 report in its entirety.
DISCLAIMER
This publication is distributed by the U.S. Department of Transportation, National Highway Traffic Safety Administration, in the interest of information exchange. The opinions, findings, and conclusions expressed in this publication are those of the authors and not necessarily those of the Department of Transportation or the National Highway Traffic Safety Administration. The United States Government assumes no liability for its contents or use thereof. If trade or manufacturers’ names or products are mentioned, it is because they are considered essential to the object of the publication and should not be construed as an endorsement. The United States Government does not endorse products or manufacturers.
Suggested APA Format Citation:
|
Blincoe, L. J., Miller, T. R., Zaloshnja, E., & Lawrence, B. A. (2015, May). The economic and societal impact of motor vehicle crashes, 2010. (Revised) (Report No. DOT HS 812 013). Washington, DC: National Highway Traffic Safety Administration. i Technical Report Documentation Page |
||||||||||||||||||||||||||||||||||||||||||
|
1. Report No. DOT HS 812 013 |
2. Government Accession No. |
3. Recipient’s |
Catalog No. |
|||||||||||||||||||||||||||||||||||||||
|
4. Title and Subtitle The Economic and Societal |
Impact |
of |
Motor |
Vehicle |
Crashes, |
2010 |
(Revised) |
5. Report May2015 |
Date |
|||||||||||||||||||||||||||||||||
|
6. Performing |
Organization |
Code |
||||||||||||||||||||||||||||||||||||||||
|
7. Authors Lawrence Blincoe, Lawrence, Ph.D. |
Ted |
R. |
Miller, |
Ph.D., |
Eduard |
Zaloshnja, |
Ph.D., |
Bruce |
A. |
8. Performing |
Organization |
Report No. |
||||||||||||||||||||||||||||||
|
9. Performing Organization Name and Address National Center for Statistics and Analysis |
10. Work |
Unit |
No. (TRAIS) |
|||||||||||||||||||||||||||||||||||||||
|
National Highway Traffic Safety Administration Washington, DC 20590 |
11. Contract |
or Grant No. |
||||||||||||||||||||||||||||||||||||||||
|
12. Sponsoring Agency Name and Address U.S. Department of Transportation National Highway Traffic Safety Administration 1200 New Jersey Avenue SE. Washington, DC 20590 |
13. Type of Report and Period Covered NHTSATechnical Report |
|||||||||||||||||||||||||||||||||||||||||
|
14. Sponsoring Agency Code |
||||||||||||||||||||||||||||||||||||||||||
|
15. Supplementary Notes |
||||||||||||||||||||||||||||||||||||||||||
|
16. Abstract In 2010, there were 32,999 people killed, 3.9 million were injured, and 24 million vehicles were damaged in motor vehicle crashes in the United States. The economic costs of these crashes totaled $242 billion. Included in these losses are lost productivity, medical costs, legal and court costs, emergency service costs (EMS), insurance administration costs, congestion costs, property damage, and workplace losses. The $242 billion cost of motor vehicle crashes represents the equivalent of nearly $784 for each of the 308.7 million people living in the United States, and 1.6 percent of the $14.96 trillion real U.S. Gross Domestic Product for 2010. These figures include both police‐reported and unreported crashes. When quality of life valuations are considered, the total value of societal harm from motor vehicle crashes in 2010 was $836 billion. Lost market and household productivity accounted for $77 billion of the total $242 billion economic costs, while property damage accounted for $76 billion. Medical expenses totaled $23 billion. Congestion caused by crashes, including travel delay, excess fuel consumption, greenhouse gases and criteria pollutants accounted for $28 billion. Each fatality resulted in an average discounted lifetime cost of $1.4 million. Public revenues paid for roughly 7 percent of all motor vehicle crash costs, costing tax payers $18 billion in 2010, the equivalent of over $156 in added taxes for every household in the United States. Alcohol involved crashes accounted for $52 billion or 22 percent of all economic costs, and 84 percent of these costs occurred in crashes where a driver or non‐occupant had a blood alcohol concentration (BAC) of .08 grams per deciliter or greater. Alcohol was the cause of the crash in roughly 82 percent of these cases, causing $43 billion in costs. Crashes in which alcohol levels are BAC of .08 or higher are responsible for over 90 percent of the economic costs and societal harm that occurs in crashes attributable to alcohol use. Crashes in which police indicate that at least one driver was exceeding the legal speed limit or driving too fast for conditions cost $52 billion in 2010. Seat belt use prevented 12,500 fatalities, 308,000 serious injuries, and $50 billion in injury related costs in 2010, but the failure of a substantial portion of the driving population to buckle up caused 3,350 unnecessary fatalities, 54,300 serious injuries, and cost society $10 billion in easily preventable injury related costs. Crashes in which at least one driver was identified as being distracted cost $40 billion in 2010. The report also includes data on the costs associated with motorcycle crashes, failure to wear motorcycle helmets, pedestrian crash, bicyclist crashes, and numerous different roadway designation crashes. |
||||||||||||||||||||||||||||||||||||||||||
|
17. Key Words Economic, cost, harm, comprehensive cost, motor vehicle, crashes, traffic, accidents, alcohol, speed, seat belts, distraction, helmet, motorcycle, congestion, travel delay, source of payment, fatalities, injuries, unreported crashes, property damage, pedestrian, bicyclist, interstate intersection, roadway departure |
18. Distribution Statement Document is available to the public from the Technical Information Service www.ntis.gov. |
National |
||||||||||||||||||||||||||||||||||||||||
|
19. Security Unclassified |
Classif. |
(Of this |
report) |
20. Security page) Unclassified |
Classif. |
(Of this |
21. No. of Pages 304 |
22. Price |
||||||||||||||||||||||||||||||||||
|
Form DOT F 1700.7 (8-72) |
Reproduction of |
completed page |
authorized |
|||||||||||||||||||||||||||||||||||||||
Executive Summary
In 2010 the total economic cost of motor vehicle crashes in the United States was $242 billion. This represents the present value of lifetime economic costs for 32,999 fatalities, 3.9 million non-fatal injuries, and 24 million damaged vehicles. These figures include both police-reported and unreported crashes. When quality-of-life valuations are considered, the total value of societal harm from motor vehicle crashes in 2010 was $836 billion.
All costs in this report are expressed in year 2010 economics using a 3-percent discount rate. Nonfatal injury costs are stratified by severity level based on the Abbreviated Injury Scale,
1 but unit costs based on the KABCO scale commonly used in police reports are also supplied in an appendix. The cost components include productivity losses, property damage, medical costs, rehabilitation costs, congestion costs, legal and court costs, emergency services such as medical, police, and fire services, insurance administration costs, and the costs to employers. Values for more intangible consequencessuch as physical pain or lost quality-of-life are also examined in estimates of comprehensive costs, which include both economic cost components and quality-of-life valuations.
Economic Impact of Crashes
■
The economic cost of motor vehicle crashes that occurred in 2010 totaled $242 billion. This is equivalent to approximately $784 for every person living in the United States and 1.6 percent of the U.S. Gross Domestic Product.■
The lifetime economic cost to society for each fatality is $1.4 million. Over 90 percent of this amount is attributable to lost workplace and household productivity and legal costs.■
Each critically injured survivor (using the MAIS 5 scale) cost an average of $1.0 million. Medical costs and lost productivity accounted for 82 percent of the cost for this most serious level of non-fatal injury.■
Lost workplace productivity costs totaled $57.6 billion, which equaled 24 percent of the total costs. Lost household productivity totaled $19.7 billion, representing 8 percent of the total economiccosts.
1
The Abbreviated Injury Scale (AIS) is an anatomically based, consensus-derived global severity scoring system that classifies each injury by body region according to its relative importance on a 6-point ordinal scale (1=minor and 6=maximal). AIS is the basis for the Injury Severity Score (ISS) calculation of the multiply injured patient. The AIS was developed by the Association for the Advancement of Automotive Medicine (AAAM) See www.aaam1.org/ais/ for further information. 2■
Total property damage costs for all crash types (fatal, injury, and property damage only [PDO])totaled $76.1 billion and accounted for 31 percent of all economic costs.
■
Property-damage-only crashes (in which vehicles were damaged but nobody was injured) cost $71.5 billion and accounted for 30 percent of total economic motor vehicle crash costs.■
Present and future medical costs due to injuries occurring in 2010 were $23.4 billion, representing10 percent of the total costs. Medical costs accounted for 21 percent of costs from non-fatal injuries.
■
Congestion costs, including travel delay, added fuel usage, and adverse environmental impacts cost$28 billion, or 12 percent of total economic crash costs.
■
Police-reported crashes account for 83 percent of the economic costs and 89 percent of total societal harm that occurs from traffic crashes. Crashes that are not reported to the police account for 17 percent of economic costs and 11 percent of total societal harm.■
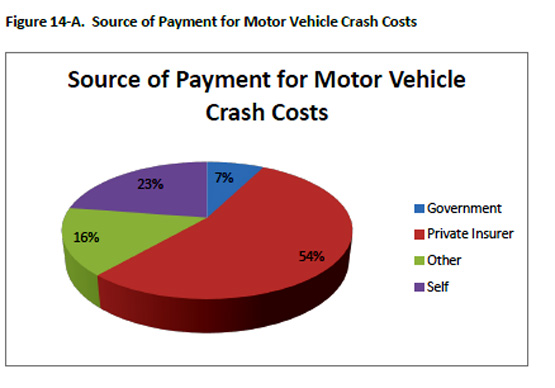
Approximately 7 percent of all motor vehicle crash costs are paid from public revenues. Federal revenues accounted for 4 percent and States and localities paid for approximately 3 percent. An additional 1 percent is from programs that are heavily subsidized by public revenues, but for which the exact source could not be determined. Private insurers pay approximately 54 percent of all costs. Individual crash victims pay approximately 23 percent while third parties such as uninvolvedmotorists delayed in traffic, charities, and health care providers pay about 16 percent. Overall, those
not directly involved in crashes pay for over three-quarters of all crash costs, primarily through insurance premiums, taxes and congestion related costs such as travel delay, excess fuel consumption, and increased environmental impacts. In 2010 these costs, borne by society rather than by crash victims, totaled over $187 billion.
Incidence of Crashes
■
Some 3.9 million people were injured in 13.6 million motor vehicle crashes in 2010, including 32,999 fatalities. Twenty-four percent of these injuries occurred in crashes that were not reported to police.■
About 23.9 million vehicles were damaged in motor vehicle crashes in 2010; 18.5 million or 77 percent of these vehicles were damaged in incidents that incurred property damage only. The remaining 23 percent involved injuries to occupants of the vehicle, or to nonoccupants such as pedestrians or bicyclists.■
Approximately 60 percent of property-damage-only crashes and 24 percent of all injury crashes are not reported to the police. Unreported injury crashes tend to involve only minor or moderate injuries. 3Alcohol Involvement in Crashes
■
Alcohol-involved crashes resulted in 13,323 fatalities, 430,000 nonfatal injuries, and $52.5 billion in economic costs in 2010, accounting for 22 percent of all crash costs.■
Crashes involving drivers or nonoccupants with a blood alcohol concentration of .08 grams per deciliter or higher (the legal definition of impairment in all States) accounted for 84 percent of the total economic cost of all alcohol-involved crashes.■
The impact of alcohol involvement increases with injury severity. Alcohol-involved crashes accounted for 14 percent of property-damage-only crash costs, 17 percent of nonfatal injury crash costs; and 48 percent of fatal injury crash costs.■
Although drinking drivers may experience impaired judgment, perceptions, and reaction times, not all crashes in which alcohol was present were caused by alcohol. Crashes in which alcohol was the cause resulted in 11,226 fatalities, 326,000 nonfatal injuries, and $43.2 billion in economic costs. This is approximately 84 percent of the alcohol-related fatalities and 82 percent of alcohol-related economic costs. It represents 34 percent of all fatalities and 18 percent of all costs from motor vehicle crashes.Impact of Speed-Related Crashes
■
Crashes in which at least one driver was exceeding the legal speed limit or driving too fast for conditions cost $52 billion in 2010.■
Speed-related crashes are associated with 10,536 fatalities, 800,000 nonfatal injuries and damage to3.0 million vehicles in property-damage-only crashes. This represents 32 percent of all fatalities; 20 percent of all nonfatal injuries, and 16 percent of all property-damage-only crashes.
■
Speed-related crashes cost an average of $168 for every person in the United States. Seat Belt Use■
In 2010, seat belts prevented 12,500 fatalities and 308,000 serious injuries, saving $50 billion inmedical care, lost productivity, and other injury-related costs.
■
Seat belt non-use represents an enormous lost opportunity for injury prevention. In 2010 alone, over 3,350 people were killed and 54,300 were seriously injured unnecessarily because they failed to wear their seat belts, costing society $10.43 billion.■
Over the past 36 years, since FARS started collecting data in 1975, seat belts have prevented over280,000 fatalities and 7.2 million serious injuries. This saved society $1.2 trillion in medical care, lost productivity, and other injury-related economic costs. During the same time period, nearly 367,000 additional fatalities and 5.8 million additional serious injuries could have been prevented by seat belts if all occupants had used them. This represents an economic loss of roughly $1.1 trillion in unnecessary expenses and lost productivity. 4
Distracted Driving Crashes
■
Crashes in which at least one driver was identified as being distracted resulted in 3,267 fatalities,735,000 nonfatal injuries and damaged 3.3 million vehicles in property-damage-only crashes in
2010. This represents about 10 percent of all motor vehicle fatalities and 18 percent of all nonfatal crashes. These crashes cost $39.7 billion in 2010, roughly 16 percent of all economic costs from motor vehicle crashes.
Societal Impacts of Crashes (Comprehensive Costs)
■
The value of societal harm from motor vehicle crashes, which includes both economic impacts and valuation for lost quality-of-life, was $836 billion in 2010. Seventy-one percent of this value represents lost quality-of-life, while 29 percent is economic impacts.■
The lifetime comprehensive cost to society for each fatality is $9.1 million. Eighty-five percent of this amount is attributable to lost quality-of-life.■
Each critically injured survivor (MAIS 5) has comprehensive costs that average of $5.6 million. Lost quality-of-life accounted for 82 percent of the total harm for this most serious level of non-fatal injury.■
Alcohol-involved crashes resulted in $236 billion in comprehensive costs in 2010, accounting for28 percent of all societal harm from motor vehicle crashes. Eighty-five percent of these costs occurred in crashes where one driver had a BAC of .08 g/dL or greater.
■
Although drinking drivers may experience impaired judgment, perceptions, and reaction times, not all crashes in which alcohol was present were caused by alcohol. Crashes in which alcohol was the cause resulted in $194 billion in societal harm in 2010. This represents 23 percent of all societal harm from motor vehicle crashes. Ninety-four percent of societal harm from crashes caused by alcohol occurs in crashes where drivers had BACs of .08 or greater.■
Crashes in which at least one driver was exceeding the legal speed limit or driving too fast for conditions caused $203 billion in comprehensive costs in 2010. This represents 24 percent of all societal harm from motor vehicle crashes.■
Crashes in which at least one driver was identified as being distracted caused $123 billion in comprehensive costs in 2010, causing roughly 15 percent of all societal harm from motor vehicle crashes.■
In 2010, seat belts prevented $329 billion in comprehensive costs to society. Over the last 36 years, seat belts have prevented $7.6 trillion in societal harm, resulting in lower economic costs to society and improved quality-of-life for millions of motor vehicle occupants. 5====================================================================
Bicyclist Crashes
: Bicyclist crashes resulted in 632 fatalities, 79,000 injuries, and 9.078 PDO damaged vehicles in 2010.59 This represents 2 percent of all fatalities and roughly 1 percent of all nonfatal crashes (including both nonfatal injury and PDO). These crashes caused $4 billion in economic costs and $22 billion in comprehensive costs, accounting for 2 percent of all economic costs, and 3 percent of all societal harm (measured as comprehensive costs).14. Source of Payment
The economic toll of motor vehicle crashes is borne by society through a variety of payment mechanisms. The most common of these are private insurance plans such as Blue Cross-Blue Shield, HMOs, commercial insurance policies, or worker’s compensation. Medicare is the primary payer for people over the age of 65. When these sources are not available, government programs such as Medicaid may provide coverage for those who meet eligibility requirements. A host of other Federal, State, and local programs such as CHAMPVA, Tricare, Title 5, and Indian Health Services also provide health care coverage for specific groups. Expenses not covered by private or governmental sources must be paid out-of-pocket by individuals, or absorbed as losses by health care providers.
Blincoe (1996) provided estimates of sources of payment for motor vehicle crashes that combined analysis of CODES data with previous estimates developed by the Urban Institute (Miller et al., 1991). This data was also used in the previous version of this current study (Blincoe et al., 2002). For this current report, data from Blincoe (1996) were carried forward for insurance administration, workplace
costs, legal costs, and congestion while new estimates of source of payment were developed for medical care, lost productivity, and property damage. Blincoe also estimated values for emergency services. However, in that study ambulance costs were included under emergency services, while for this current study, ambulance costs are included under medical care. Ambulance costs had been distributed across
all payer categories in the same proportion as medical care. To adjust for this, the impact of ambulance
costs was removed from the EMS distribution. This results in 100 percent of emergency service costs being born by States and localities (primarily localities). However, we note that over the past few years, primarily in response to budget tightening that has resulted from the economic downturn, many local fire departments and other EMS operators have begun charging insurance companies and in some cases individuals for their services. This practice has become controversial and has been banned in a number of States. Nonetheless, it is likely that some portion of emergency services are in fact now being paid through insurance, and possibly by individuals. It is not certain whether in the long run this practice will become more widespread or will decline due to legislative actions. As this is a relatively recent practice, to date we know of no studies that have examined these impacts on an aggregate basis.
We have also added an additional payer category, "unspecified government," to this study. This category represents programs that are funded primarily by government revenues, but that are lumped together in HCUP data and that therefore cannot be individually identified as belonging to either State or Federal categories. In addition, some of these programs are partially funded by participants through subsidized premium charges. Programs in these categories include Veterans’ Administration, Tricare, Title 5, Indian Health Services, and State and local health care programs. These are programs that cover medical care for service personal and their families, veterans’, Native Americans, and State and local employees. In previous studies, these costs were lumped under the "Other" category. We have categorized them with government programs because they are either entirely supported by, or heavily 236
subsidized by, tax dollars, but some unknown portion of these costs are paid by individual insurance premiums.
Following are discussions of the derivation of revised source of payment estimates for medical care, lost productivity, and property damage.
Medical Costs
Miller et al. (2011) provide factors for computing the percentage of crash costs paid by State/local and Federal governments. Table 1, drawn from that paper, is built from the million-record 2007 Healthcare Cost and Utilization Project (HCUP) Nationwide Inpatient Sample (NIS). Medical costs were estimated using hospital charges, as recorded in the NIS, with hospital-specific cost-to-charge ratios supplied by HCUP. The NIS also records the expected payer for each hospital stay, which allowed estimation of the amount paid by payer. Medicaid paid an estimated 15.8 percent of hospital costs for motor vehicle crashes and Medicare paid 7.3 percent.
Zaloshnja and Miller (2012) analyzed Medicaid claims and HCUP data from 14 States. They estimated
that 22 percent of adults ages 19 to 64 with hospital-admitted crash injuries covered by Medicaid (2.85% of all those admitted) became Medicaid-eligible because earnings losses and medical bills resulting from crash injury left them indigent or disabled. The crash resulted in Medicaid paying all their medical bills, not just their injury bill. Zaloshnja and Miller (2012) further estimate that 35 percent of those who convert to Medicaid to pay hospital bills stay on Medicaid indefinitely. The present value of their lifetime Medicaid health care costs averages $316,000 (computed following the article’s methods but
substituting fiscal year 2009 Medicaid spending of $15,840 per disabled recipient from:
www.statehealthfacts.org/comparetable.jsp?ind=183&cat=4.)
Beyond crash medical costs, that adds an estimated $3,152 ($316,000×0.0285×0.35) in Medicaid costs for other care to government’s crash bill per hospital-admitted non-elderly crash survivor. With roughly
5.4 percent of medically treated crash survivors admitted, added government cost due to Medicaid conversion is $170 per injured crash survivor.
The division of Medicaid costs between the Federal and State levels varies by State. On average, States paid 35.2 percent in Fiscal Year 2011 ( Office of the Assistant Secretary for Planning and Evaluation,
2012).
Among the elderly, HCUP data show private insurance paid 50.0 percent of the medical cost of crash injuries but only 7.4 percent of the cost of other injuries. The 42.6 percent differential presumably is due to medical costs borne by or recovered from auto insurers. Assuming this percentage applies to injuries not requiring hospital admission is aggressive. Health insurers are less likely to pursue recovery through subrogation for smaller medical bills. Nevertheless, if we make that assumption, an estimated $14.85 billion in medical costs would be compensated by auto insurance. Since available auto insurance data do not decompose compensation for medical costs versus work losses (or even quality-of-life), we used the
42.6 percent compensation for medical care to compute the compensation level for wage and household work loss. 237
| Table 14-1. Primary payer for medical costs of hospital-admitted road crash injuries, by age, United States, as per 2007 HCUP-NIS Payer* |
Ages
0–18 |
Ages
19–64 |
Ages
≥65 |
All
Ages |
| Medicare | 0.4% | 2.3% | 40.5% | 7.3% |
| Medicaid | 30.6% | 12.1% | 2.2% | 15.8% |
| Private | 59.4% | 44.4% | 50.0% | 56.1% |
| Self | 4.3% | 10.5% | 2.8% | 10.9% |
| Charity | 0.3% | 1.2% | 0.0% | 1.2% |
| Other | 4.5% | 7.7% | 4.4% | 8.5% |
| Unknown | 0.5% | 0.2% | 0.2% | 0.3% |
Figure 14-A. Source of Payment for Motor Vehicle Crash Costs
To some extent it is illusory to disaggregate costs across payment categories because ultimately, it is individuals who pay for these costs through insurance premiums, taxes, direct out-of-pocket cost, or higher charges for medical care. A real distinction can be made, however, between costs borne by those directly involved in the crashes and costs that are absorbed by the rest of society. Costs paid out of Federal or State revenues are funded by taxes from the general public. Similarly, costs borne by private insurance companies are funded by insurance premiums paid by policyholders, most of whom are not involved in crashes. Even unpaid charges, which are absorbed by health care providers are ultimately translated into higher costs that are borne by a smaller segment of the general public – users of health care facilities. From this perspective, perhaps the most significant point from Table 14-4 is that society at large picks up over three-quarters of all crash costs that are incurred by individual motor vehicle crash victims.