Grattan Institute Support
Founding members Endowment Supporters
 The
Myer Foundation National Australia Bank Susan
McKinnon Foundation
The
Myer Foundation National Australia Bank Susan
McKinnon Foundation
![]() Affiliate Partners
Affiliate Partners
Susan McKinnon Foundation
 Senior
Affiliates
Cuffe Family
Foundation Maddocks
Senior
Affiliates
Cuffe Family
Foundation Maddocks
 Medibank
Private The
Myer Foundation Scanlon
Foundation Trawalla Foundation
Wesfarmers
Westpac
Medibank
Private The
Myer Foundation Scanlon
Foundation Trawalla Foundation
Wesfarmers
Westpac
Affiliates Allens Ashurst
The Caponero Grant Corrs
![]() Flagstaff
Partners McKinsey &
Company Silver Chain
Flagstaff
Partners McKinsey &
Company Silver Chain
Urbis Woodside
Grattan Institute Report No. 2020-15, November 2020
Overview
Australian governments are fast-tracking
their transport projects, hoping for an infrastructure-led recovery from the
pandemic-induced recession. But those ‘infrastructure pipelines’ are
constipated by megaprojects that are too slow to be effective stimulus
and
prone to mammoth cost overruns.
Governments should act now to set current
projects on a sounder basis, and take steps to avoid ending up here again.
The era of megaprojects has arrived. It’s 10 years since Australia’s first
transport infrastructure
project worth
at least
$5 billion;
now there are nine such
projects under construction. Before the pandemic, the value of transport
infrastructure under construction for Australian governments reached $125
billion for the first time, and two thirds
of that
work was
on projects
worth $5
billion or
more. Billion-dollar projects
are no
longer unusual.
The
2020
Commonwealth
Budget upped
the
transport
spend
to
one-and-a-half
times
the
usual
level.
Megaprojects are already breaking records for cost overruns. There’s an overrun so far of $24 billion on just six current projects:
-
Inland Rail was costed at $4.4 billion in 2010; it’s now estimated to cost $9.9 billion.
-
Melbourne’s North East Link was costed at $6 billion in 2008; it’s now expected to cost $15.8 billion, even though the Victorian Government selected the cheapest route.
-
The Sydney Metro City & Southwest was costed at $11 billion in 2015; this year the NSW Government announced the latest estimate was $15.5 billion.
Even before the megaprojects era, cost overruns were a mega-problem. Over the past two decades, Australian governments spent $34 billion more on transport infrastructure than they first told us they would.
Grattan Institute’s analysis of all projects valued at $20 million or more and built over the past 20 years shows that the actual costs exceeded the promised costs by 21 per cent.
Big projects are particularly risky. More than one third of overruns since 2001 came from just seven big projects. Eighty per cent of the cost overruns came from just 14 per cent of projects; that 14 per cent exceeded their originally promised cost by more than half. Some overruns are the size of a megaproject themselves: for $1 billion-plus projects with an overrun, that overrun averaged more than $1 billion.
Projects announced before governments are prepared to formally commit are also particularly risky. Only one third of projects are announced prematurely, but they account for more than three quarters of the cost overruns. Premature announcements would be no problem if Australia had a robust process for cancelling the duds, but most projects, once announced, are seen through to completion.
Right now, governments are focused on creating jobs and stimulating the economy by spending money quickly. But spending big on transport projects makes little sense, because even before the pandemic, the Prime Minister, Treasurer, and state infrastructure ministers were worried that there weren’t enough workers, materials, and machinery for the massive construction workload. When there are already bottlenecks, racing to build projects dreamt up before the pandemic just pushes up prices. Governments would get bigger bang for taxpayer buck by instead spending more on upgrading existing infrastructure, and on social infrastructure such as aged care and mental health care.
Governments should rethink major projects that have been promised or are under construction, particularly those announced without a business case. Governments should continuously disclose to Parliament material changes to expected costs and benefits, as listed companies do to the stock exchange. To avoid ending up here again in future, governments should collect data on and learn lessons from past projects. Megaprojects should be a last, not a first resort.
Table of contents
Overview.................... 3
|
Building infrastructure like there’s no tomorrow . . . . . . . . . |
. 5 |
|
|
Bigger projects are riskier projects . . . . . . . . . . . . . . . . |
. 14 |
|
|
Prematurely announced projects are riskier . . . . . . . . . . . |
. 19 |
|
|
The current crop of projects is already breaking records for cost overruns . . . . . . . . . . . . . . . . . . . . . . . . . . . |
. 22 |
|
|
What governments should do immediately . . . . . . . . . . . |
. 29 |
|
|
How to avoid ending up here again . . . . . . . . . . . . . . . |
. 36 |
|
|
Methodological appendix . . . . . . . . . . . . . . . . . . . . . |
. 46 |
|
|
Risk appendix . . . . . . . . . . . . . . . . . . . . . . . . . . . |
. 48 |
1 Building infrastructure like there’s no tomorrow
Before the pandemic, public infrastructure was booming in Australia. In March 2020, the value of the road and rail projects being built across the country exceeded $120 billion for the first time.1
Not only was the amount of work at an all-time high, so was the size of projects being built. It is no longer true that only a couple of very large projects are being built at any one time; now, most of the work being done is on ‘megaprojects’ – commonly defined as projects costing
$1 billion or more (Figure 1.1). In fact, we have entered an era of mega megaprojects, with most work being done on projects with an expected cost of more than $5 billion. During the past five years, the value of an average road or rail project being built more than doubled, from $430 million to $1.1 billion (Figure 1.2 on the next page).
That was before the pandemic. Now, there are calls for even more public infrastructure. The Governor of the Reserve Bank has called
for Australian governments to increase public investment to create jobs through infrastructure.2 The Prime Minister has called for the states
to spend more on ‘good projects’.3 The transport and infrastructure ministers of all jurisdictions say they are ‘clearing the way for an infrastructure-led recovery’.4
Given that Australia was already in new territory before the pandemic, there is a big question mark over the wisdom of this path. The risk
of rushing yet more projects into a construction sector that’s already building more and larger projects is that the projects may end up costing more or providing fewer benefits than anticipated – or both. In other words, even that minority of projects that have been through a
Figure 1.1: All the growth in public road and rail infrastructure work is in megaprojects
Expected cost of projects under construction, $2020 billion
![]() 140
140
 120
120
![]() 100
100
80
60
40
20
0
2001 2004 2007 2010 2013 2016 2019
Note: Includes all public road and rail projects costing more than $20 million. Source: Grattan analysis of Deloitte Access Economics Investment Monitor.
![]()
1. Includes all projects costing more than $20 million.
2. Lowe (2020, p. 5).
3. Coorey and Cranston (2020).
4. Transport and Infrastructure Council (2020, p. 1).
reasonable assessment process before the decision to build may turn out not to have been worth building at all.
1.1 Cost overruns are more likely and larger when projects are bigger
Larger projects are more likely to have cost blowouts. This is unsurprising, because larger projects have more interdependent elements, any one of which could suffer a setback that flows through to other elements.
Not only are bigger projects more likely to have a cost blowout, but when it happens, that blowout is likely to be larger, both in dollar terms and as a proportion of the project’s cost. More than one third of transport overruns since 2001 came from just seven of the largest projects. And there are more and more large projects: 10 years ago
the work on hand included four projects valued at $2 billion or more in today’s dollars; by the start of 2020, this number had increased to 14.
1.1.1 Even before COVID, many projects weren’t going well
Even before the pandemic, there was disquiet about the scale of the public infrastructure being built. In 2019, Infrastructure Australia warned that ‘while large-scale projects are becoming common place, they are also stretching the capacity of industry and government’.5
The Prime Minister said: ‘We are really starting to hit our head on the ceiling in terms of how much infrastructure work you can get under way at any one time. And that’s actually putting some cost pressures into the system.’6
Figure 1.2: The average project under construction now is worth more than $1 billion
Average expected cost of projects under construction, $2020 billion
1.2
![]()
1
0.8
0.6
0.4
0.2
0
2001 2004 2007 2010 2013 2016 2019
Note: Includes all public road and rail projects costing more than $20 million. Source: Grattan analysis of Deloitte Access Economics Investment Monitor.
The federal Treasurer noted there were ‘capacity constraints . . . related to skills, to materials, whether that be bitumen, cement, diesel, our boring equipment, and the like’.7
In March 2020, the Council of Australian Governments decided that it needed to start monitoring infrastructure market conditions and capacity.8
It is not hard to see cause for disquiet. The average size of completed transport projects had been relatively steady over recent years – until 2019. But the average value of projects completed in 2019 was twice that of projects completed over the previous five years (Figure 1.3).
Some high-profile problems give further cause for concern. Sydney’s CBD and South East Light Rail, and Melbourne’s West Gate Tunnel have been particularly troubled. The following sections tell their stories.
Figure 1.3: The average cost of completed projects leapt in 2019
Average final cost of completed projects, $2020 million
![]() 600
600
500
400
300
200
Case study 1: Sydney’s CBD and South East Light Rail
The NSW Government first allocated significant funds to the CBD and South East Light Rail project in the June 2013 state Budget. The expected cost then was $1.6 billion.9 The plan was to run a new light
100
0
2001
2004
2007
2010
2013
2016
2019
rail line from Circular Quay through George Street to Central Station and to the University of NSW via Anzac Parade and Alison Road. Later that year, the Government said the benefits would be worth $4 billion, and the benefit cost ratio would be 2.5.10
Seven years on, it’s a very different story. Services began operating along the full length of the line in April 2020, at an eventual cost of about $3.1 billion.11 The latest published benefit estimate is $3 billion,12
Note: Includes all public road and rail projects costing more than $20 million. Source: Grattan analysis of Deloitte Access Economics Investment Monitor.
![]()
8. Council of Australian Governments (2020).
9. NSW Government (2013, Section 4, p. 46).
10. Audit Office of New South Wales (2016, p. 7).
11. Audit Office of New South Wales (2020, pp. 1–2).
12. Audit Office of New South Wales (2016, p. 4).
but that hasn’t been updated since 2015,13 and therefore does not include a reduction in the benefits that were initially estimated from changes to bus services.14 Nor does it include a benefit reduction that arose because the construction was more distressing to residents and businesses than had been anticipated15 – so much so that they have filed a class action.16
What happened in those seven years? A damaging dispute with the contractor was part of the story, and so was a series of governance shortcomings.
A damaging dispute with the contractor
The Government signed a contract in December 2014 with ALTRAC Light Rail, a consortium comprising Acciona Infrastructure Australia, Alstom, Capella Capital, and Transdev.17 The estimated cost had already gone up by this time, to $2.1 billion, due mostly to mispricing and omissions in the business case.18
Further overruns were caused by the unexpectedly high cost of digging up and replacing powerlines on George Street. In April 2018, the consortium filed a lawsuit in the NSW Supreme Court, alleging that the NSW Government had engaged in misleading or deceptive conduct when providing information regarding Ausgrid powerlines.19
The NSW Government reached a settlement with the contractors. The cost to Government for the settlement was $576 million, which included
incentive payments ($44 million) and a two-year extension to ALTRAC’s licence to operate the light rail (worth $221 million).20
A series of governance shortcomings
Poor management between 2011 and 2014 increased the project’s complexity and risk and reduced the value for money, according to a 2016 Auditor-General’s report.21
To begin with, Transport for NSW, rather than an independent body, did the assurance reviews of the project. This approach ‘did not provide the independent assurance required for such a major infrastructure project’.22
Management of the project also departed from the planning process in the state’s Major Projects Assurance Framework. Transport for NSW ‘skipped two mandatory gateway reviews that could have forced it to resolve deficiencies in the project’s governance arrangements and economic appraisal’.23 For example, in June 2013 the project team identified significant design issues. Yet Transport for NSW did not recognise or resolve these issues in the business case, or accurately estimate the related costs.24
Case study 2: Melbourne’s West Gate Tunnel
In April 2016, the Victorian Government signed an in-principle agreement with Transurban to build the West Gate Tunnel, at an expected cost of $5.5 billion. The expected benefit cost ratio was 1.1.25
![]()
![]()
13. Audit Office of New South Wales (2020, p. 1).
14. Ibid (p. 3).
15. Legislative Council Public Accountability Committee (2019, p. ix).
16. Supreme Court of New South Wales (2020); and Parkes-Hupton (2019).
17. Audit Office of New South Wales (2016, p. 26).
18. Ibid (p. 4).
19. Audit Office of New South Wales (2020, p. 6).
20. Ibid (p. 6).
21. Audit Office of New South Wales (2016, p. 9).
22. Ibid (p. 9).
23. Ibid (p. 9).
24. Ibid (p. 15).
25. VAGO (2019a, p. 43). The business case for the project included a headline benefit cost ratio of 1.3, but this number referred to a combined ‘project’ which
The plan was to build a 5km toll road linking the West Gate Freeway at Yarraville with the Port of Melbourne and CityLink at Docklands,
including twin tunnels beneath Yarraville, a bridge over the Maribyrnong River, and a road above Footscray Road. Transurban had put the plan to the Government as a market-led proposal.
Today, the story is very different. The expected cost has increased to
$6.7 billion.26 The latest publicly available estimate of the benefit cost ratio, in 2018, put it at 1.0.27
The increase in costs has been attributed primarily to the discovery of soil contamination. Other problems include the need to relocate utility pipes, and shortcomings in governance.
A three-way dispute over soil contamination
The discovery of Per and Polyfluoroalkyl Substances (PFAS) in soil on the site of the West Gate Tunnel has led to significant delays and costs.28 The project will now be delivered at least one year later than originally planned, in 2023 at the earliest.29 Delays in work have also led to many lay-offs.30
At issue is who is responsible for dealing with the contamination. Under the contracts, Transurban generally carries the risk of dealing with any existing contamination it disturbs during construction.31 Transurban also carries the risks of complying with planning approvals, of construction
![]()
included the Monash Freeway Upgrade. The Victorian Auditor-General’s Office (VAGO) noted that the inclusion of the Monash Freeway Upgrade in the calculation
and design, and of ‘a general change in law’. The Government carries the risk of a ‘project specific change in law or change in policy’, and the two parties share the risk for unforeseeable or ‘force majeure’ events.32
Proceedings have commenced between Transurban and the building consortium of CPB and John Holland over the additional costs incurred as a result of PFAS contamination, estimated at $1 billion.33 The building consortium has claimed the soil issue is an unforeseeable circumstance that makes it impossible to fulfil the terms of a contract.
If this claim is found valid, it would enable the termination of its contract with Transurban. Transurban has indicated it may seek to terminate its contract with the Government on the same grounds of force majeure.34
In September 2020, the Environmental Protection Authority approved Environment Management Plans for two landfill sites in outer Melbourne to receive soil from the West Gate Tunnel Project.35
Relocation of utility pipes has caused additional cost
Under Victoria’s Major Transport Projects Facilitation Act, gas, water, and sewerage pipes, and electricity cables, must be moved to make way for major projects within 30 days.36 It has been reported that
the Government failed to notify utility companies about the West Gate Tunnel project’s special status under the act.37 This has led to
significant delays and increases in cost, which in turn has led to further arbitration between the Government, Transurban, and the building consortium.38
was inconsistent with the state Department of Treasury and Finance guidelines on
separate business cases: VAGO (2019a, p. 43).
26. Ibid (p. 52).
27. Ibid (p. 53).
29. Rooney (2020a).
30. Rooney (2020b).
31. Treasurer of Victoria and Transurban (2017, Clause 7.2).
32. Victorian Government (2017, pp. 19–22).
33. Wiggins (2020a).
35. Terzon (2020).
36. Jacks (2020).
37. Ibid.
38. Ibid.
Governance shortcomings
The West Gate Tunnel is an unusual megaproject in that it was a market-led proposal. According to advice from the Department of Treasury and Finance to the Government in December 2017,39 the usual tender process was bypassed, and a contract signed with Transurban, on the grounds that the company’s offer was ‘unique’.
Figure 1.4: Budgeted Commonwealth spending on transport is higher than ever
Estimated transport infrastructure spend, per cent of GDP
![]() 0.7%
0.7%
 Budget
2020-21
Budget
2020-21
0.6%
Budgets 2012-13
to 2018-19
The uniqueness related solely to Transurban’s ability to get funding for the project via increased and/or extended tolls on its existing CityLink concession. An Auditor-General’s report quite reasonably questioned whether funding should have been considered the defining ‘unique’ characteristic to exclude a competitive procurement process, since the community will pay for the project whichever funding source is adopted.40
1.1.2 The infrastructure surge is risky
0.5%
0.4%
0.3%
0.2%
![]() 0.1%
0.1%
0.0%
Budget 2019-20
![]() One
of the
many responses
to the
pandemic has
been the
call
for
One
of the
many responses
to the
pandemic has
been the
call
for
more infrastructure as stimulus.41 Public infrastructure spending is a traditional recourse when the economy tanks, for several reasons. One is the idea that construction not only props up employment, but in so doing it creates useful assets; road and rail upgrades facilitate the efficient movement of people and goods, leading to greater tax revenues down the track that help to pay for the infrastructure. A second reason is that stimulus-oriented construction can be wound
back more easily once the economy is on a better footing,42 unlike, for instance, an increase to unemployment payments.
The Federal Government has responded to calls for infrastructure as stimulus. In its 2020 Budget, it steps up funding for transport to $11.5
![]()
39. VAGO (2019a, p. 35).
40. Ibid (p. 36).
41. For example: Kehoe (2020), Wright and Crowe (2020) and Albanese (2020).
42. IMF (2020, p. 32).
2012 2014 2016 2018 2020 2022 2024
Financial year ending
Source: Commonwealth budget papers.
billion in 2020-21, $12.7 billion the following year, then about $13.5 billion in each of the following two years.43 This is about one-and-a-half times the usual levels of funding from the Commonwealth (Figure 1.4). The Budget includes $750 million for Queensland’s Coomera Connector Stage 1, and about $600 million each for upgrades to the New England and Newell Highways in NSW.44
Will this uptick in funding be an effective form of stimulus? There are three reasons for scepticism.
![]()
43. Commonwealth of Australia (2020a, Section 6, p. 37).
44. Commonwealth of Australia (2020b, pp. 131–132).
First, it’s not a foregone conclusion that a public infrastructure project will be effective as stimulus. As leading fiscal policy expert Valerie Ramey puts it, ‘details really matter’.45 In a comprehensive review of the fiscal responses since the Global Financial Crisis, she concludes that government infrastructure projects are not the best form of stimulus because they take a long time to get going.46 (That’s not to say they couldn’t be worthwhile in the longer run, provided the benefits outweighed the costs.)
A second reason for scepticism about infrastructure as stimulus is the capacity of the construction industry. Even before the pandemic, governments were worried about the industry’s capacity to take on more work on top of the record quantity of works in general and megaprojects in particular that were under construction. According to the International Monetary Fund, ‘project delays are longer if projects are approved and undertaken when public investment is significantly scaled up’.47
The number of people working in engineering construction surged by 50 per cent in the three years before the pandemic (Figure 1.5). The image people may have of construction work as unskilled is out of date; as leading urban economist Ed Glaeser puts it, ‘big infrastructure requires fancy equipment and skilled engineers, who aren’t likely to be unemployed’.48 During the mining boom, skilled labour and machinery were imported. But with national borders closed, this option is not available now or for the foreseeable future.
A third reason for scepticism about transport infrastructure as stimulus is that even before the pandemic, governments were already struggling to spend their budget allocations. Commonwealth allocations to the
Figure 1.5: More people are employed in engineering construction than ever
People employed in heavy and civil engineering construction, thousands
![]() 140
140
 120
120
100
80
60
40
![]() 20
20
![]() 0
0
1984 1989 1994 1999 2004 2009 2014 2019
Source: ABS (2020a, Table EQ06).
states for transport infrastructure were underspent by $1.7 billion in 2019-20.49 The Federal Government attributed this underspend to COVID-19 and the bushfires, yet it also underspent on transport infrastructure by about $2 billion over the preceding two years.50
In a recession, a sound micro-economic framework is one of the best protections we have. As the Productivity Commission has observed: ‘If you build things solely for demand-side stimulus, you run the risk of
wasteful spending. If you do careful project assessment, you can boost productive capacity and aggregate demand.’51
1.2 Projects conceived pre-pandemic are likely to suffer benefit underruns
A benefit underrun is just as serious as a cost overrun. Either shortcoming can render a project not worth building.
Information about benefits of a project is harder to come by than information about costs. Business cases often contain very little information about the expected traffic volumes underlying the benefits counted in a road project. Expected traffic volumes for toll roads have occasionally come to light after the road is completed, often as part of a court hearing that has arisen through actual patronage being much lower than expected.52
For rail projects, it can be even harder to assess benefits. Tasked with assessing benefits from the Regional Rail Link Project, the Victorian Auditor-General’s Office noted: ‘Poor benefit management practices
by DOT [the Department of Transport] made it very challenging, if not impossible, to measure today whether the project has delivered all its expected benefits, and thus the level of value for money achieved.’53
This report is not about benefits, because the data is so scanty, but benefits should still be borne in mind when considering the merits of infrastructure proposals. The problem with projects conceived before the pandemic is that they are likely to under-achieve their benefits, for two reasons.
1.2.1 Population growth has fallen off a cliff
Population growth underpins the business cases of most if not all the transport infrastructure projects to which governments have committed. The Council of Australian Governments acknowledged this, discussing in early 2020 ‘the market’s capacity to deliver Australia’s record pipeline of infrastructure investment to support the country’s growing population’.54 Population growth exacerbates urban congestion, and creates pressure to upgrade ports, airports, and other facilities.
But the COVID crisis has caused population growth to fall off a cliff. Net overseas migration fell from 239,600 in 2018-19 to minus 72,000 in 2020-21.55 We should not assume a return to the high-immigration policies that Australia had for many years before COVID.
Natural increase is well down too. Australia’s fertility rate, currently at 1.69 babies per woman,56 is expected to fall to 1.62 by early next decade.57 The Australian Government expects the rate of population
![]()
49. Commonwealth of Australia (2020c, p. 7).
50. Commonwealth of Australia (2019, p. 80); and Commonwealth of Australia (2018,
p. 80).
51. Brennan (2020).
52. See Black (2014). This report relies on newspaper reports for data on expected and actual traffic volumes of road projects, because no relevant official publications were made public.
53. VAGO (2018).
54. Council of Australian Governments (2020).
55. ABS (2020b); and Commonwealth of Australia (2020a, Section 2, p. 34).
56. Commonwealth of Australia (2020a, Section 2, p. 34).
57. McDonald (2020, pp. 2–4).
growth to be permanently lower than the rates assumed before COVID-19.58
Of course, infrastructure is a long-term investment, and Infrastructure Australia is continuing to take a 30-year view of projects, even in
the midst of COVID-19. But we don’t yet know whether Australia will resume its old path in a couple of years. Fertility rates in the rest of the rich world, and China, are already consistent with long-run population decline. India and the world as a whole are not yet in this territory, but total fertility rates are declining steadily.59
1.2.2 Work and travel patterns are likely to be different post-pandemic
Before the pandemic, few Australians worked from home. In Sydney, Melbourne, and Brisbane, about 5 per cent did, and in Perth and Adelaide it was about 4 per cent.60 The numbers were small, but the trend was up: the rate of working from home increased by about half a percentage point between 2011 and 2016 in each of Australia’s five largest cities.61
That changed, of course, with the pandemic. People who could work from home did so; an estimated 40 per cent of jobs can be done from home in Australia.62
Some people love the flexibility and comfort of working at home, and enjoy the time that used to be swallowed up with commuting. Others miss the social side of work, and find it difficult to work while their children are at home. Some businesses look forward to saving on office rental costs; others are concerned about doing new business in a world
![]()
58. Commonwealth of Australia (2020a, Section 2, p. 34).
60. Terrill et al (2018, Chapter 4).
61. Ibid (Chapter 4).
62. Ulubasoglu and Onder (2020).
where people don’t often meet face to face. Future work patterns and preferences are unclear.63
Likewise, future demand for public transport is unclear. No one knows how effective a future COVID-19 vaccine may be, or what kinds of social distancing requirements may be required long term. If social distancing is sustained, public transport projects – premised on the idea of carrying large numbers of people in close proximity – will need to be rethought.
In a time of high uncertainty, the best strategy is to keep options open. Major commitments to new transport infrastructure conceived for very different times make little sense right now. The mantra of stimulus does not mean that every project is a good one.
1.3 The structure of the remainder of this report
Chapter 2 shows that big projects are particularly risky, and that megaprojects often lead to mega overruns.
Chapter 3 establishes that premature announcements are a major risk factor in cost overruns.
Chapter 4 demonstrates that projects now being built have already had big cost overruns, and there are more to come.
Chapter 5 identifies what governments should do right now to minimise the likelihood and extent of current projects costing more than expected.
Chapter 6 nominates what governments should do to ensure they don’t end up in this situation again in future.
![]()
63. Beck et al (2020) found that 71 per cent of people who’d worked from home during the pandemic say they would like to work from home more often in the future. But how frequently people will actually work from home after the pandemic remains very uncertain.
2 Bigger projects are riskier projects
 Taxpayers
spent $34
billion more
on transport
infrastructure projects
between 2001 and 2020 than they had been first told they would spend.64
These additional
costs amount
to more
than one
fifth of
the initially expected costs.
Taxpayers
spent $34
billion more
on transport
infrastructure projects
between 2001 and 2020 than they had been first told they would spend.64
These additional
costs amount
to more
than one
fifth of
the initially expected costs.
It would seem that nothing has been learnt in the past four years. In 2016, Grattan Institute found that taxpayers had paid $28 billion more on transport infrastructure over the previous 15 years than they had been told they would pay.65 Our 2016 report, Cost overruns in transport infrastructure, was the most comprehensive study of Australian projects ever conducted, covering every transport infrastructure project that governments had planned or built since 2001.66
In that report, and this one, we compared the cost of projects at first announcement to the cost at completion. Some people argue that cost overruns should only be measured from the point that a formal cost benefit analysis is completed or a funding commitment made.67 But we think that measuring from first cost announcement is necessary if we are to explore the realpolitik of infrastructure funding. Politicians often promise to build infrastructure without a cost benefit analysis or a funding commitment, and most of these projects go on to be built.
Politicians and the public take these promises seriously, and so do we (see Box 1 for the example of Sydney Metro North West).
![]()
64. The ‘aggregate cost overrun’ of $34 billion is equal to ‘total cost overruns’ of $38 billion minus ‘total cost underruns’ of $4 billion.
65. In 2016 dollars: Terrill and Danks (2016).
66. The 2016 report and this one use data on project costs from the Deloitte Access Economics Investment Monitor. See Appendix A for details of the Investment Monitor, as well as our analysis methodology.
67. Love et al (2015, pp. 493–494); Love et al (2016, p. 185); and Seimiatycki (2009,
pp. 144–145).
 Section
2.2 shows
that larger projects are more likely to have a cost overrun, and a larger
one. Section
2.3 shows
that a minority of larger projects cause much of the problem. But first,
Section
2.1
explains what’s wrong
with promising
to build
infrastructure for
less than
it really
costs.
Section
2.2 shows
that larger projects are more likely to have a cost overrun, and a larger
one. Section
2.3 shows
that a minority of larger projects cause much of the problem. But first,
Section
2.1
explains what’s wrong
with promising
to build
infrastructure for
less than
it really
costs.
2.1 Unrealistic cost estimates distort investment and mislead the public
Unrealistic cost estimates for transport infrastructure distort investment planning in three ways.
First, if governments systematically understate project cost estimates, then benefit cost ratios will be systematically overstated. This leads governments to over-invest in transport infrastructure.
Second, if governments misunderstand the uncertainty in a project’s cost at the time they make a commitment, their decision to invest in that project was made on an incorrect basis. Inaccurate cost estimates distort the decision to invest, and which projects to select. The design and scope of a project can change over its life, but this rarely justifies not holding governments to account for the initial cost estimates
(Box 2).
Third, because unrealistic cost estimates are more prevalent for larger projects, governments are more likely to over-invest in larger projects. The clearest example of this is multi-billion dollar projects, which have historically had more frequent and larger cost overruns.
As well as distorting investment decisions, unrealistic cost estimates mislead the public. We are led to believe that a particular project is available to us for less than it really is. Yet governments almost never go back and discover how actual costs and benefits compare to the costs and benefits that were promised. If they do go back, they do not share their findings with the public.
2.2 Big projects overrun more often and by more
Bigger projects tend to be more complex, so it’s not surprising that they are more prone to cost overruns. They also tend to overrun by more, in dollar terms, and often in percentage terms as well (Figure 2.1).
The relationship between project size and overruns is not new. In 2014 Danish economic geographer Bent Flyvbjerg coined ‘the iron law of megaprojects: over budget, over time, over and over again’.68 Our 2016
Figure 2.1: Bigger projects overrun more often and by more
Frequency of overruns and average increase in cost as a percentage of initial project costs by level of initial cost
![]() 60%
60%
More
report found that a 10 per cent increase in project size (measured by cost estimate when first under construction) was associated with a 6 per cent higher chance of a cost overrun.69
2.3 A few projects cause a lot of trouble
The problem of cost overruns is concentrated. It’s not a case of small amounts adding up across the 33 per cent of projects that have an overrun. Instead, more than 80 per cent of total cost overruns were caused by the 14 per cent of projects that exceeded their initial cost by more than 50 per cent (Figure 2.2 on the following page).70
More than one third of the aggregate cost overrun since 2001 came
50%
40%
30%
![]() 20%
20%
10%
0%
Less than
![]()
![]()
![]()
![]()
![]()
![]()
![]()
![]() $350m
$350m

$350m
![]()
![]()
![]()

- $1b
![]()
![]()
![]()
than $1b


![]()
![]()
![]()
![]()
![]()
![]() from
just seven
of the
projects with
the highest
final costs
(Table
2.1
on
from
just seven
of the
projects with
the highest
final costs
(Table
2.1
on
the next page).
Frequency of overruns Average increase in cost Note: Includes all public road and rail projects costing more than $20 million that were completed between Q1 2001 and Q1 2020.
Source: Grattan analysis of Deloitte Access Economics Investment Monitor.
![]()
68. Flyvbjerg (2014, pp. 9–11).
69. Terrill and Danks (2016, p. 31).
70. These projects resulted in a total of $31 billion in overruns. This is about 82 per cent of the $38 billion of total cost overruns. (The aggregate cost overrun of
$34 billion is total cost overruns minus total cost underruns.)
![]() Table
2.1: Seven
of the
largest projects
completed in
the past
two decades accounted for more than one third of overruns
Table
2.1: Seven
of the
largest projects
completed in
the past
two decades accounted for more than one third of overruns
Project Year
completed
Final cost ($2020b)
Overrun ($2020b)
Figure 2.2: Large cost overruns are infrequent, but expensive
 Overrun
>50%
Overrun
>50%
100%
![]() Sydney
Metro
Northwest
2019
7.9
0.7
Sydney
Metro
Northwest
2019
7.9
0.7
Clem Jones Tunnel (Brisbane) 2010 4.2 3.1
Airport Link (Brisbane) 2012 4.2 2.7
Eastlink (Melbourne) 2008 3.6 1.7
Epping to Chatswood Rail Link (Sydney) 2008 3.6 2.0
CBD and South East Light Rail (Sydney) 2019 3.3 1.6
New MetroRail (Perth) 2007 2.7 0.8
![]() Note:
Costs inflated
to Q1
2020 from
the mid-point
of each
project’s construction
period using ABS producer price index for road and bridge construction.
Note:
Costs inflated
to Q1
2020 from
the mid-point
of each
project’s construction
period using ABS producer price index for road and bridge construction.
Sources: Grattan analysis of Deloitte Access Economics Investment Monitor, AECOM (2020), Brisbane City Council (2004, p. 2), SGS Economics & Planning (2019, p. 35), Queensland Government and Brisbane City Council (2005, p. 2), Bligh (2008), Audit Office of New South Wales (2020, p. 1), WA Government (2001, p. 917), and WA Government (2002, p. 892).
Overrun 25-50%
Overrun <25%
On budget
Underruns
Share of projects Share of total cost overruns
80%
60%
40%
20%
0%
-20%
The overruns on the largest projects are often the size of a large project. For the $1 billion-plus projects that had an overrun, the average increase in cost was more than $1 billion (Figure 2.3 on the following page). Almost half of the projects with an initial price tag of more than
$1 billion in today’s money had an overrun (Figure 2.1 on the previous page).
The portfolio now under construction includes many mega megapro- jects, valued at more than $5 billion, and the recent history of high overruns on the largest projects suggests there are storms ahead.
The next chapter focuses on the other key predictor of cost overruns – premature announcements.
Note: Includes all public road and rail projects costing more than $20 million that were completed between Q1 2001 and Q1 2020.
Source: Grattan analysis of Deloitte Access Economics Investment Monitor.
Figure 2.3: When a large project has an overrun, it’s likely to be large
Cost overrun, for projects that had an overrun, $2020 billion
 3.0
3.0
2.5
2.0
1.5
1.0
0.5
0.0
$350m $1b Projects ordered by initial cost ($2020), smallest to largest
Note: Includes public road and rail projects costing more than $20 million that were completed between Q1 2001 and Q1 2020 and that had an overrun.
Source: Grattan analysis of Deloitte Access Economics Investment Monitor.
3 Prematurely announced projects are riskier
As a project evolves, the cost estimates evolve too. The cost estimates of big projects, in particular, change from first announcement to strategic business case to final business case to planning application, procurement, awarding of the contract, and finally to the ultimate cost of the completed project.
When a project is announced early, before a formal commitment such as a funding allocation, this usually means its cost estimate is a preliminary one, and does not incorporate a detailed engineering design or feasibility assessment.
Figure 3.1: Prematurely announced projects account for most of the value of cost overruns


100%
75%
50%
There would be no problem with such early announcements if Australia had a robust process for cancelling those projects that, on closer examination, turned out not to be worth building, or not the best
option available. But we don’t have such a process; once a project is announced, it usually ends up being built. More than 80 per cent of projects that had an initial cost estimate of at least $20 million announced since 2001 were seen through to completion.71
25%
0%
Share of projects Share of the aggregate cost
overrun
An announcement is premature when a government or opposition announces it will build a project for a particular cost, but the project does not yet have the regulatory and/or financial approvals that constitute a technical commitment, and which are needed before it can actually proceed. Premature announcements of this kind are not
Note: Includes all public road and rail projects costing more than $20 million that were completed between Q1 2001 and Q1 2020.
Source: Grattan analysis of Deloitte Access Economics Investment Monitor.
![]() the
norm.72
They occur
about one
third of
the time,
but they
have been responsible
for more
than three
quarters of
the cost
overruns over
the past two decades (Figure
3.1).
the
norm.72
They occur
about one
third of
the time,
but they
have been responsible
for more
than three
quarters of
the cost
overruns over
the past two decades (Figure
3.1).
71. Based on the shares of projects listed as ‘Completed’ versus ‘Deleted’ in the
Investment Monitor historical record. The share of projects ‘Completed’ may be an underestimate of the actual share of projects that get completed because the Investment Monitor wraps some ‘Deleted’ projects into broader projects. On the other hand, it’s possible that a higher proportion of the ‘ongoing’ projects will end up being deleted. If this is the case, the share of projects ‘Completed’ may be an overestimate of the actual share of projects that get completed.
72. For the analysis in this chapter we have defined a first cost announcement as ‘premature’ if the accompanying status in the Investment Monitor is ‘Possible’ or ‘Under consideration’ (and not ‘Committed’ or ‘Under construction’). Once projects reach the ‘Committed’ status they ‘have received the necessary regulatory and financial approval’ according to the definitions and classifications document that accompanies the Investment Monitor.
Projects with premature cost announcements exceed their promised cost by an average of 35 per cent; this is more than twice the percentage overrun (13 per cent) for projects that had their first cost announced upon or after commitment. And the more premature the announcement, the larger the overrun (Figure 3.2).
It might be hoped that floating a cost estimate early in the process would trigger the necessary refinements to the expected cost in the lead-up to commitment, so that the cost estimate at the time of commitment would be more accurate than for other projects.
Unfortunately this is not the case. While the cost estimate for a prematurely announced project increases by an average of 18 per cent by the time it is formally committed, it doesn’t end there; the cost estimate then increases again by a further 16 per cent on average by the time the project is completed – slightly higher than the 13 per cent average overrun for projects that have their first cost announced upon or after commitment.
Premature announcements often go hand in hand with larger projects.73 Almost half of the projects initially expected to cost $500 mil- lion or more in today’s dollars had a premature cost announcement.
Figure 3.3 on the following page shows that prematurely announced projects are haunted by cost overruns throughout their life, and that these projects started out substantially bigger, on average, than those projects announced in a more orthodox way.
Figure 3.2: The earlier the first cost announcement, the larger the overrun
![]() Average
change in
cost as
a percentage
of initial
project costs,
by length
of time between
first cost
announcement and
commencement of
construction
80%
Average
change in
cost as
a percentage
of initial
project costs,
by length
of time between
first cost
announcement and
commencement of
construction
80%
 More
than 2
years
More
than 2
years
60%
40%
![]() 20%
20%
0%
Note: Includes all public road and rail projects costing more than $20 million that were completed between Q1 2001 and Q1 2020.
Source: Grattan analysis of Deloitte Access Economics Investment Monitor.
![]()
73. Despite projects with premature cost announcements being larger on average, there are still poor cost outcomes among smaller projects with premature cost announcements. For projects with an initial cost of up to $100 million, the average cost outcome for projects with a premature cost announcement was a 33 per cent overrun, compared to a 17 per cent overrun on projects without a premature cost announcement.
Figure 3.3: Projects with premature cost announcements are haunted throughout their lives
Average project size by project stage, $2020 million
 450
450
400
350
![]() 300
300
250
200
Projects with first cost announced upon commitment
![]()
![]() Projects
with first
cost announced
upon
construction
Projects
with first
cost announced
upon
construction
150
![]() First
public
cost
Commitment
Commencement
First
public
cost
Commitment
Commencement
of construction
Completion
Note: Includes all public road and rail projects costing more than $20 million that were completed between Q1 2001 and Q1 2020.
Source: Grattan analysis of Deloitte Access Economics Investment Monitor.
4 The current crop of projects is already breaking records for cost overruns
In the past two decades, Australian governments have spent $34 billion more than they initially said they’d spend on transport infrastructure projects. But that sum is being dwarfed by what’s now unfolding.
So far, Australian governments will spend at least $24 billion more than they said they would on just six extremely large, or ‘mega’ megaprojects.
Previous chapters established that large projects are at greater risk of cost overruns (Chapter 2), as are prematurely announced projects (Chapter 3). This chapter shows that the current crop of projects is breaking records in two ways: the number of extremely large projects currently being built (Section 4.1), and the size of the cost overrun that has already been confirmed on these extremely large projects (Section 4.2). And Section 4.3 suggests further records may yet be broken.
4.1 A record number of mega megaprojects are being built
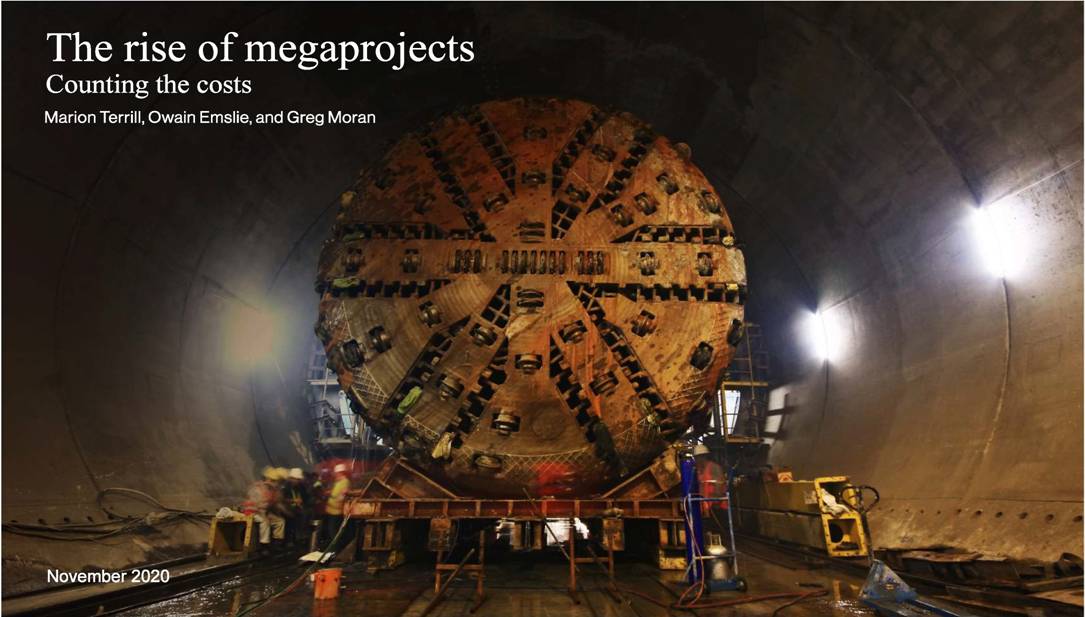
Ten years ago, Australia had just one mega megaproject valued at
$5 billion or more in today’s dollars under construction: the Airport Link M7 and Northern Busway in Brisbane (Figure 4.1). At the time it was considered ‘the most complex road and tunnel engineering feat in Queensland’s history’,74 and it made use of Australia’s two largest
tunnel boring machines as well as 17 road header machines – the most on any Australian construction project to that time.75
Figure 4.1: The number of projects expected to cost $5 billion or more has grown dramatically in just a few years
Number of projects under construction with an expected cost of at least $5 billion ($2020)
![]() 10
10
![]() 8
8
6
4
2
0
2001 2004 2007 2010 2013 2016 2019
Source: Grattan analysis of Deloitte Access Economics Investment Monitor.
Now Australia has nine projects of this size or larger under construc- tion:76
• WestConnex (Sydney)
• Sydney Metro City & Southwest
• Metro Tunnel (Melbourne)
• Inland Rail (Melbourne to Brisbane)
• Cross River Rail (Brisbane)
• West Gate Tunnel (Melbourne)
• Removal of an additional 25 level crossings (Melbourne)
• METRONET (Perth)
• Pacific Highway Upgrade – Woolgoolga to Ballina (NSW)
The capacity of the engineering construction sector to manage so many projects on such an enormous scale has been called into question.77
Projects worth more than a couple of hundred million dollars can only be taken on by Tier 1 contractors, of which there are three in Australia: CPB, John Holland, and Acciona.
Industry players, large and small, are calling for large and megaprojects to be split into smaller packages of works, so that mid-tier firms can tender for them.78
But even if this happens in future, it won’t change what’s already in train.
![]()
76. This does not include the North East Link project in Melbourne (discussed further in Section 4.2.2 on page 25), for which major works are yet to commence.
77. For example: Coorey (2019), Caisley (2019) and Infrastructure Australia (2019,
p. 208).
78. For example: Croagh (2020) and Hayford (2020a, p. 7).
4.2 Cost overruns on a handful of mega megaprojects are breaking records
The West Gate Tunnel project in Melbourne has already exceeded its initial cost estimate by more than $1 billion,79 and there are reports that costs could further blow out.80 But the West Gate Tunnel is not the project with the largest cost overrun of recent times. It is one of six
mega megaprojects that are being built and have generated $24 billion worth of cost increases, confirmed as at late 2020 (Figure 4.2 on the next page). There is no guarantee that there won’t be further overruns in future.
Chapter 1 told the story of the West Gate Tunnel. The following sections tell the story of each of the other five current mega megaprojects that already has a substantial overrun.
4.2.1 WestConnex
WestConnex is a 33km tolled motorway that will link the west and south-west of Sydney with Sydney Airport and Port Botany. It includes about 19km of tunnels. The project is being completed in stages, with two major sections already open: WestConnex M4 between Parramatta and Haberfield, and WestConnex M8 between Kingsgrove and St Peters. Two 7.5km tunnels to link these sections (the ‘M4-M5 Link’) are due to be completed in 2023.81
While the fundamental purpose of the project has remained unchanged, scope changes have seen its estimated cost rise by about
$2 billion. And because of uncertainty about the basis of early cost estimates, many people expect an overrun closer to $7 billion.82
![]()
79. Edwards (2017).
80. Jacks (2020).
82. For example: O’Sullivan (2016), Australian Associated Press (2016) and Sanda (2017).
WestConnex was first proposed by Infrastructure NSW, and adopted by the NSW Government, in October 2012.83 The initial proposal differed to the final plans in a number of respects, but the essential nature of the project was the same: a 33km motorway to connect a widened
and extended M4 to the M5 East corridor, providing better access to the airport and the port.84 While the original plan was to connect to
a widened M5 East, the final plan involved connecting to a ‘New M5’, later renamed the WestConnex M8.
The initial cost estimate for the project that grabbed the headlines was
$10 billion.85 However, a joint study by Infrastructure NSW and the NSW Government published at the time of the original announcement noted that the cost could be as high as $13 billion.86 That study also indicated that the estimate had been discounted to 2012 dollars, meaning the ‘outturn’ cost – the nominal amount that would be spent in total over the project’s expected 10-year life – would be a lot higher.
The 2013 NSW Budget referred to the $10-to-$13 billion range as the ‘Estimated Total Cost’.87 This caused confusion because ‘Total
estimated cost’ is usually reported on a nominal outturn basis in budget infrastructure statements.
The business case was completed later in 2013, and contained a refined estimate of $11-to-$11.5 billion ($2012).88 The $11.5 billion estimate was then reported in the 2014 NSW Budget, where an outturn cost of $14.9 billion was also reported.
The estimated outturn cost was half-a-billion dollars higher in the 2015 Budget, with the increase attributed to the addition of tunnels for a
Figure 4.2: Just six mega megaprojects have caused $24 billion in cost overruns so far
![]()
![]() $
billion
$
billion
WestConnex
North East Link
Sydney Metro City & Southwest
Inland Rail
Cross River Rail
West Gate Tunnel
Total overrun
![]()
83. Trembath (2012).
84. SGS Economics & Planning (2015).
85. For example: Budd (2013).
86. Infrastructure NSW, TfNSW, and RMS (2012, p. 26).
87. NSW Government (2013, Section 3, Page 4).
88. WestConnex (2013, p. 15).
0 5 10 15 20 25
Sources: As referenced throughout Section 4.2.
future southern extension and additional scoping works around the St Peters interchange.89 The estimate jumped a further $1.4 billion to
$16.8 billion in the 2016 Budget after an updated business case in late 2015. This remains the current estimate. The updated business case attributed the almost-$2 billion increase since the first business case estimate of $14.9 billion to:90
• extension of the M4-M5 Link to the Anzac Bridge, Victoria Road, and the future Western Harbour Tunnel and Beaches Link
($1.2 billion); and
• provision for an ‘enhanced’ connection to the terminals of Sydney Airport (the ‘Sydney Gateway’) ($402 million); and
• ‘acceleration costs and associated delivery costs for scope enhancements’ ($322 million).
4.2.2 North East Link
The cost of the North East Link, a toll road in Melbourne which will join the M80 Ring Road to the Eastern Freeway, has leapt since an estimated cost was first announced in 2008.
The North East Link was included in the Victorian Government’s Victorian Transport Plan in 2008, with a cost of ‘more than $6 billion’.91
Two changes of government later, the Andrews Government announced its intention to proceed with the project in December 2016, then with an expected cost of $10 billion.92 At this point, a route for the road was yet to be determined.
Costings for four potential routes were released in August 2017, ranging from $7 billion to $23 billion.93
In November 2017, the Government announced that the cheapest of the four routes had been selected, though the expected cost was now
$16.5 billion.94 Part of the extra cost related to widening of the Eastern Freeway, necessary to accommodate extra traffic coming off the North East Link.95 However, the project’s fundamental purpose remained unchanged: connecting the M80 Ring Road to the Eastern Freeway. In May 2018, a business case was completed, which revised the expected cost down slightly to $15.8 billion.96
4.2.3 Sydney Metro City & Southwest
The City & Southwest section is the second stage of the Sydney Metro system, following the Northwest section, which was opened in May 2019. The main feature of the system is high-frequency, driverless trains operating on mostly underground lines.
The Sydney Metro City & Southwest project will extend the Northwest line by 30km, from Chatswood in the north to Bankstown in the
south-west, via the CBD. The project involves twin tunnels under Sydney Harbour, from Chatswood to Sydenham in the inner west.
Cost estimates for the project crept up in the early years of planning, before an overrun of $3 billion was announced because construction was proving more expensive than expected. An internal review has also suggested that costs could increase by a further $1 billion.
![]()
89. Saulwick (2015).
90. WestConnex (2015, Table E2, p. 24).
91. Victorian Government (2008, p. 12). See also Pallas (2008) and Parliament of
Victoria (2020, p. 3).
92. Galloway (2016).
![]()
94. Andrews (2017).
95. Lucas and Jacks (2017); and Victorian Government (2018a, p. 4).
96. Victorian Government (2018a, p. 7).
Media reporting in 2015 had early cost estimates for the project of up to
$11 billion.97 A year later, the expected cost was between $11.5 billion and $12.5 billion.98
In February this year the NSW Government announced an overrun of $3 billion on the project, with the current estimate now sitting at
$15.5 billion. NSW Transport Minister Andrew Constance attributed the overrun to higher costs because of higher demand in the market:99
I am sorry it happened this way but it is very much market forces at play in terms of the build. We are not denying there hasn’t been significant cost pressures on the project. . . If you go back five years ago, I think it’s fair to say that not even Treasury could predict the escalation increases in the infrastructure market. And it’s not just in Sydney.
The Minister’s comments reflect the story being told in Figure 6.3 on page 43. Transport construction costs were flat between late 2013 and late 2016, but grew strongly thereafter.
Regardless of the market movements, however, there are questions over the early cost estimates. Former WestConnex and Transfield chair Tony Shepherd has suggested the $12.5 billion figure was ‘probably
an early estimate before the facts were in’.100 More generally, he also recommended governments be ‘very careful on making the point that estimates in the early days are just preliminary estimates because no one has done the work yet’.
The Sydney Metro City & Southwest project may face further overruns. An internal budget review is reported to have forecasted a final cost
4.2.4 Inland Rail
Inland Rail is a 1,700km freight railway line connecting the ports of Melbourne and Brisbane. Its ultimate cost is expected to far exceed the initial estimate.
The current route was first specified in a 2010 report by the Australian Rail Track Corporation, which estimated the cost at $4.4 billion.102
In 2015, a full business case was completed, with the likely, or median, cost estimate now $9.9 billion.103 Based on this business case, Infrastructure Australia assessed the benefit cost ratio (BCR) at 1.1 and noted: ‘Given the marginal nature of the BCR, an increase in project cost could have a significant impact on the final BCR.’104 The 2017 Commonwealth Budget noted that ‘the project is sensitive to increases in project cost’.105
National Trunk Rail, proponents of a rival plan to build an inland rail, have suggested the costs of the project will blow out further, to $16 billion, because the project involved upgrading existing lines and connecting them.106
The Millmerran Rail Group of farmers from the Darling Downs has claimed that the project is open to cost blowouts because the chosen route is through a floodplain.107
4.2.5 Cross River Rail
The 2017 Queensland Budget estimated the cost of the Cross River Rail project, which includes a new line under the Brisbane River, at
of $16.8 billion – $1.3 billion higher than the current $15.5 billion
estimate.101
![]()
97. Beech (2015); and Kembrey (2015).
100. Rabe and O’Sullivan (2020).
101. O’Sullivan (2020b).
102. P50 or median cost: ARTC (2010, p. 14). The P90 cost was estimated at $4.7 billion.
103. ARTC (2015, p. 166).
104. Infrastructure Australia (2016, p. 6).
105. Commonwealth of Australia (2017, Section 9, p. 11).
106. Wiggins (2017).
107. Ludlow (2019).
$5.4 billion.108 The 2019 Budget included an additional $1.48 billion of ‘private finance contributions’, bringing the total project cost to $6.9 billion.109
Despite this change in budgeted cost, it continues to be referred to as a $5.4 billion project,110 and the Queensland Government insists the project is still on budget.111
Technical issues related to the Boggo Road station including problems with the track alignment could cause a cost overrun, though the Government has not adjusted the official expected cost.112
In April 2020, the independent board overseeing the project was removed.113 The Cross River Rail Authority now reports directly to Cross River Rail Minister Kate Jones. She said this change was made to improve oversight of the project in an attempt to avoid cost overruns:114
[I want] a direct line of sight on how we build the Cross River Rail project. It’s my job to hold [contractor CPB] to that contract. . . You need to be hands-on to keep the contractor accountable. They need to know we are breathing down their neck.
In July 2020, the Shadow Transport Minister wrote to the Auditor- General suggesting the actual cost may be as high as $12 billion.115
![]()
108. Queensland Government (2017, p. 74).
109. Queensland Government (2019, pp. 103–104). See also Adept Economics (n.d.).
110. For example: Elks and Williams (2020); Elks (2020); Knowles (2020) and Gordon
111. Marszalek (2020).
112. McCutcheon (2020).
113. Crockford and Lynch (2020).
114. Elks and Williams (2020).
115. Minnikin (2020).
The project did not receive approval from Infrastructure Australia
In July 2017, Infrastructure Australia reviewed the project’s business case, and decided not to award the proposal the status of ‘Project’ on the Infrastructure Priority List. Infrastructure Australia considered that the benefits in the business case were significantly overstated, and that the costs of the project were likely to exceed its benefits.116
Infrastructure Australia continued to list the project as an ‘Initiative’, suggesting further business case development as a next step, until it was removed from the priority list in 2019, because construction had commenced.117
The Queensland Deputy Premier questioned the independence of Infrastructure Australia in light of its rejection of the Cross River Rail business case.118
4.3 Other records may yet be broken
Large projects come with cost risk, as do prematurely announced projects. Either of these characteristics on its own should prompt caution. A combination of the two should mean red flags.
For example, in March 2019 the Commonwealth Government announced an initial cost estimate of $4 billion for Geelong Fast Rail when announcing $2 billion of federal funding for the project.119
However, on the same day as the Commonwealth’s announcement, the Victorian Transport Minister, Jacinta Allan, cast doubt over the estimate, and was reported as saying the project would cost up to three times as much.120
![]()
116. Infrastructure Australia (2017).
117. Infrastructure Australia (2020, p. 12).
118. Caldwell (2018).
119. Harris and Galloway (2019).
120. Jacks et al (2019).
4.3.1 Melbourne’s Metro Tunnel is at risk of a large overrun
Construction of the Metro Tunnel commenced in 2018.121 The project is expected to be completed in 2025,122 and remains officially on budget, at a cost of $11 billion.123 However, it was reported in October 2020 that the Victorian Government had agreed to pay an extra amount to cover a share of cost overruns incurred by the contractors.124
The Auditor-General has noted that early construction works cost $150 million (or 30 per cent) more than anticipated, funded from the budget for the main works phase.125 The Auditor-General noted that ‘the heavy use of project-wide contingency funds is an early warning flag for
the project, particularly because there are at least five more years of complex and risky construction works ahead’.126
It has also been reported that unexpected problems, including geological problems, have created additional costs.127 The consortium building the Metro Tunnel project, Cross Yarra Partnership (CYP),
has sought additional Government funding.128 In 2019, a mediator was appointed to negotiate between the CYP and the Victorian Government.129
The consortium ceased tunnelling work for a period in December 2019 and has reportedly threatened to quit the project entirely unless the Government agrees to contribute to the increased costs, reported to be about $3 billion.130
![]()
121. Victorian Department of Treasury and Finance (2019).
122. Metro Tunnel (n.d.).
123. Ibid.
125. VAGO (2019b, p. 9).
126. Ibid (p. 8).
127. Jacks and Danckert (2019).
128. Willingham (2019); and Baxendale (2020).
129. Willingham (2019).
5 What governments should do immediately
This report has quantified how common cost overruns are, and how costly. It
has also quantified the cost overrun risks of large projects and
prematurely announced
projects. These
facts should
come as
no surprise to politicians, bureaucrats, or the industry.
Grattan Institute’s
2016 report,
Cost overruns
in transport
infrastructure, made recommendations that, had they been taken
up, would have significantly
ameliorated the
problem Australia
now faces. But
with little having changed
in the way projects have been selected, costed, and initiated, the most
pressing challenge for state governments now is to deal with those projects
that are already being built or about to begin.
This chapter recommends some immediate measures.
* Section
5.1 is
about how to deal with projects that are currently under construction, and
* Section
5.2 is
about how to deal with the suite of projects that governments
have committed
to building
but have
not yet
commenced.
5.1
Establish the
state of
projects currently
under
construction
Australia has a record program of transport infrastructure projects in progress, yet Australians have only limited information about the status of these projects. It seems that even governments sometimes have only limited oversight, because some projects are managed by private entities under Public Private Partnerships.
Historically it has suited governments to run their infrastructure programs
this way.
A politician
can expect
to enjoy
an electoral
benefit from announcing a new project, particularly in the lead up to
an election. If the
project ends
up costing
more than
was promised,
there is every chance the original proponent will no longer be in the
same role. And even
if they
are, there
is a
good chance
the public
will have forgotten the
original cost promise that justified the investment.
Of 32 projects larger than $500 million committed to since 2016, only eight had a business case either published, or assessed by a relevant infrastructure body at the time of commitment (Figure 5.1 on
page 31 and Table 5.1 on the following page).131 This means politicians are committing to projects without knowing whether they are in the community’s interest to build, let alone whether they are the best choice for the money.
And governance has been no better for those projects which have received Commonwealth Government support. Of 22 large projects
to which the Commonwealth Government has committed a contribution since 2016, only six had a business case published or assessed by Infrastructure Australia at the time of commitment. A further 14 were listed as ‘initiatives’ on IA’s Priority List, indicating they ‘have the potential to address a nationally significant problem or opportunity’ but that their assessment had not yet been completed. The remaining two had not appeared on any Infrastructure Australia priority list at the time a state government committed to them.
As Infrastructure Australia put it:132
Too often we see projects being committed to before a business case has been prepared, a full set of options have been considered, and rigorous analysis of a potential project’s benefits and costs has been undertaken.
Box 3 on page 32 details the particularly egregious example of Melbourne’s suburban rail loop.
![]()
131. ‘Committed’ here refers to a budget allocation being made for construction of the project in a state or territory budget.
132. Infrastructure Australia (2018a, p. 1).
![]() Table
5.1: Most
large projects
are still
committed to
without an
approved business
case
Table
5.1: Most
large projects
are still
committed to
without an
approved business
case
Project State C’wealth
contribution
IA status at commitment
Business case timing Business case distribution
![]()
Inland Rail National Y Project At time of commitment Published.
Northern Road Upgrade NSW Y Project At time of commitment Assessed by IA M80 Upgrade (Northern & Western sections) VIC Y Project At time of commitment Assessed by IA
North East Link VIC Y Project At time of commitment Assessed by IA and published
West Gate Tunnel VIC N None At time of commitment Published
Beerburrum to Nambour Rail QLD Y Project At time of commitment Assessed by IA; summary released Bruce Highway (Bribie Island Road to Steve Irwin Way) QLD Y Initiative At time of commitment Summary published by BQ
Bruce Highway (Caloundra Road to Sunshine Motorway) QLD Y Project At time of commitment Assessed by IA
F6 (Stage 1) NSW N None Assessed later Summary published by INSW
M12 Motorway NSW Y Initiative Assessed later Assessed by IA
Sydney Gateway NSW N Initiative Assessed later Summary published by INSW
Sydney Metro West NSW N Initiative Assessed later Summary published by INSW Monash Freeway Upgrade (Stage 2) VIC Y None Assessed later Assessed by IA
Bruce Highway (Woondum to Curra) QLD Y Initiative Assessed later Assessed by IA
M1 Pacific Motorway – Eight Mile Plains to Daisy Hill QLD Y Initiative Assessed later Assessed by IA; summary released M1 Pacific Motorway – Varsity Lakes to Tugun QLD Y Initiative Assessed later Assessed by IA; summary released Thornlie Line Extension WA Y Initiative Assessed later Assessed by IA
Yanchep Rail Extension WA Y Initiative Assessed later Assessed by IA
New Bridgewater Bridge TAS Y Initiative Assessed later Assessed by IA; didn’t pass Central Walk NSW N Initiative None assessed or published
North South Metro Rail Link NSW Y Initiative None assessed or published Princes Highway Upgrade (Albion Park Rail Bypass) NSW Y None None assessed or published Cranbourne Line Duplication VIC N Initiative None assessed or published
Hurstbridge Line Upgrade Stage 2 VIC N Initiative None assessed or published
Melbourne Airport Rail VIC Y Initiative None assessed or published
Suburban Rail Loop VIC N None None assessed or published
![]()
Sunbury Line Upgrade VIC N None None assessed or published Bruce Highway (Haughton River floodplain) QLD Y Initiative None assessed or published Rockhampton Ring Road QLD N None None assessed or published Bunbury Outer Ring Road (Stages 2 & 3) WA Y Initiative None assessed or published North-South Corridor (Torrens River to Darlington) SA Y Initiative None assessed or published Tonkin Highway Corridor Upgrades WA Y Initiative None assessed or published
Notes: IA = Infrastructure Australia. INSW = Infrastructure NSW. BQ = Building Queensland. Includes all fixed infrastructure projects with expected total cost greater than $500 million, committed to since December 2016. Does not include budget items referring to a program of smaller works. ‘Committed’ here refers to a budget allocation being made for construction in a state or territory budget, or the Commonwealth budget in the case of Inland Rail. A business case for Bruce Highway (Haughton River floodplain) was unsuccessfully assessed by IA..
![]()
Source: Grattan analysis.
5.1.1 Conduct an immediate stocktake
What has changed is the scale of the transport infrastructure construction agenda, and the advent of the pandemic-induced recession. These two factors make more urgent the need to review and potentially re-prioritise projects. The International Monetary Fund argues that such a review and re-prioritisation should include revisiting benefit cost analyses in light of the social changes caused
by the COVID-19 crisis. It also argues for a well-coordinated system for actively monitoring projects, differentiated by project size, complexity, and stage.133
Figure 5.1: Most large projects are still committed to without an approved business case
 Proportion
of projects
costing more
than $500m,
committed to
in 2017-2020, with
business case published or assessed by a relevant infrastructure body
Proportion
of projects
costing more
than $500m,
committed to
in 2017-2020, with
business case published or assessed by a relevant infrastructure body
Business case at commitment
No business 8

case assessed
or published
13
11 Business case
assessed later
Notes: Includes all fixed infrastructure projects with expected total cost greater than $500 million, committed to since December 2016. Does not include budget items referring to a program of smaller works. ‘Committed’ here refers to a budget
allocation being made for construction of the project in a state or territory budget, or the Commonwealth budget in the case of Inland Rail.
Source: Grattan analysis.
![]()
133. IMF (2020, p. 35).
5.1.2
 Require
continuous disclosure
of material
changes in costs and
benefits
Require
continuous disclosure
of material
changes in costs and
benefits
If companies rather than governments were making large investments in public infrastructure, those companies would have reporting obligations under the Corporations Act 2001 (Cth). Listed companies are required to report a change in their financial forecast or expectation, or that their earnings will be markedly different to market expectations.
If an equivalent regime applied to governments in respect of their investments in public infrastructure, governments would be required to report to the electorate through Parliament any material changes to expected costs, expected benefits, or expected timing of infrastructure projects, during the construction phase and on completion.134
Taxpayers are investors in public infrastructure. Governments should be legally obliged to reveal to taxpayers what they are funding.
Governments should also be transparent when they settle claims for extra funding. Even if governments view the settlement amount as confidential, they should issue an opinion from the government lawyers that the settlement amount constituted a fair and reasonable outcome for taxpayers.
Such arrangements could also improve real-time monitoring. It is well understood in other industries that close monitoring enables a project owner to nip problems in the bud. Timely information on
divergences from expectations, or major and unforeseen incidents, can prevent problems in settings ranging from mine safety135 to industrial megaprojects.136
![]()
134. The Australian Government has noted that private owners of infrastructure would be required to develop and monitor these requirements as part of their obligations to their shareholders: DIRD (2016, p. 66).
135. Brady (2019).
136. Merrow (2011).
5.2 Establish the incoming batch of projects on a sounder basis
The Commonwealth Government has increased its transport infrastructure allocation to the states, and state governments are also planning further infrastructure construction as an aid to economic recovery.
Ministers appear to be planning to further relax their already-lax standards. Their communiqué after the Transport and Infrastructure Council meeting in June 2020 illustrates their intention to over-ride infrastructure bodies or water down their role where possible:
Ministers. . . [discussed] their commitment to delivering their existing infrastructure pipelines. . . ensuring sufficient resources are deployed to move projects through assessment processes and into construction faster by targeting administrative bottlenecks. Ministers further agreed to work together to harmonise and streamline processes to clear the way for an infrastructure-led recovery to Australia’s current economic condition, including consideration of infrastructure bodies’ processes and environmental approvals.137
While ministers have the responsibility and the power to make investment decisions, they should make them with due care and diligence. They should not mislead people about what is really being promised.
5.2.1 Specify the range and status of cost estimates

Infrastructure is popular electorally, and it’s not surprising that politicians are tempted to make premature promises.
But they are unwise to specify solutions, let alone scope, cost, or timing, without a realistic idea of what is involved. In the sober
assessment of Infrastructure NSW, doing so prematurely may lead to ‘disappointment in the community and counterproductive pressure on project delivery teams’.138

5.2.2 Require independent assessment of infrastructure decisions

Governments across the country have expressed a willingness and desire to improve infrastructure decision-making, with infrastructure bodies now established in all states and within the Commonwealth (Box 4 on the following page).
Even though infrastructure advisory bodies have a variety of functions, all have the potential to assist governments improve the way they handle the risks of infrastructure projects, particularly the risks associated with size and premature announcement.
As outlined in Section 5.1, politicians have little incentive for good prac- tice in cost estimation and project announcement. If state infrastructure bodies were required to publish independent assessments of projects before money could be committed, the scrutiny on cost management and infrastructure investment decisions would be increased. This scrutiny would serve to better align politicians’ incentives to the public interest.
The additional transparency would not prevent elected representatives from doing their jobs, but would make it more costly for them to do so recklessly and without proper care for committing public money.
 Box
4:
Each
state’s
infrastructure
body
has
slightly
different
legislated
responsibilities
Box
4:
Each
state’s
infrastructure
body
has
slightly
different
legislated
responsibilities
Between 2011 and 2019, each Australian state established an infrastructure body to advise the state government on infrastructure, with varying degrees of independence.a These organisations are the state complements to Infrastructure Australia, which was established in 2008 and overhauled in 2014.
For most state bodies, the major focus is project assessment and long-term strategy:
• All states empower their agencies to assess major infrastructure proposals.b
• All states except Queensland empower their agencies to prepare a state infrastructure strategy over a 20-to-30-year horizon.c
Building Queensland is the only state body tasked with leading business case development for large projects. It leads the preparation of the business case for projects costing $100 million or more ($500
million or more for non-toll road projects), and assists in the preparation of the business case for projects costing $50-to-$100 million.d
Building Queensland also produces an infrastructure pipeline document, which identifies all major infrastructure proposals Building Queensland considers priorities.e
Similarly, Infrastructure SA produces a Statement of Capital Intentions, identifying the major infrastructure projects to be pursued in the state as a priority within the next five years.f
Infrastructure Victoria has a wider role in publishing research on infrastructure matters.g
Infrastructure NSW is the only state infrastructure body which is heavily involved in delivery of major projects. It is charged with preparing project implementation plans for major projects, and also overseeing and monitoring the delivery of major projects.h
a. Infrastructure NSW was the first established, in July 2011: Infrastructure NSW Act 2011. Infrastructure WA was the last established, in July 2019: Infrastructure Western Australia Act 2019.
b. Infrastructure Victoria does so only at the request of the Government and there is no mandatory requirement that it do so: Infrastructure Victoria Act 2015, Section 44.
c. Infrastructure NSW Act 2011, Sections 16-18; Infrastructure Victoria Act 2015, Sections 32-36; Infrastructure Western Australia Act 2019, Sections 13-17; Infrastructure SA Act 2018, Sections 20-22; and Infrastructure Tasmania (2019).
d. Building Queensland Act 2015, Section 14.
e. Building Queensland Act 2015, Section 15.
f. Infrastructure SA Act 2018, Sections 23-25.
g. Infrastructure Victoria Act 2015, Section 8.
h. Infrastructure NSW Act 2011, Sections 28-36.
6 How to avoid ending up here again
If there is no change in the way infrastructure is conceived and delivered in Australia, there’s no reason to expect any different outcome in future. Australians can expect a steady stream of cost overruns, especially on larger projects and projects that are announced before a formal commitment.
A better approach is entirely achievable, with three strategies. First, megaprojects should be the last, not the first resort. Second, the tools for estimating costs could be much better, as they are in many countries. And third, learning the lessons from completed projects
would enable successful strategies to be repeated and less successful ones avoided. The following sections explain.
6.1 Megaprojects should be the last, not the first resort
Projects worth $1 billion were a rarity two decades ago. In 2001, there were just two such projects under construction; by 2020, there were 18.
Megaprojects have become more prevalent, at the same time as there has been a push to greater national integration,139 and more active Commonwealth involvement in transport infrastructure. Bodies such as the Australian Rail Track Corporation, the National Transport Commission, and Infrastructure Australia have been created to deal with this greater focus on national planning and coordination.
The Commonwealth has not restricted itself to planning and coordination, however. Every federal budget and every federal election includes announcements of big, iconic, ‘nation-building’ infrastructure.
Megaprojects have become normal. They have often been justified on the grounds of strong population growth. What is less often stated but just as important are exceptionally low real interest rates since the Global Financial Crisis, which have resulted in very strong land
price increases. Land acquisition has become more important because planning authorities no longer assume large cities will keep expanding outwards.
Governments have choices about how to respond to these pressures.
The first resort should be efficient usage of the infrastructure we already have. If there is excessive road congestion in peak periods,
the most efficient remedy is congestion pricing.140 Public transport fares should also be higher in peak periods.141
Efficient use of existing infrastructure requires dealing with the mounting maintenance backlog. An historical underspend on preventative maintenance, a lack of data, and inadequate reporting requirements have contributed to a maintenance backlog across all infrastructure sectors. This will erode the quality and reliability of many assets and cause higher costs for future asset maintenance and renewal, according to Infrastructure Australia. ‘Unless addressed, maintenance of our transport networks will become increasingly unsustainable,’ it said in 2019.142
Governments should also modestly upgrade existing infrastructure, such as widening or upgrading key arterial roads, improving surfaces, upgrading railway stations, and improving key road intersections.
![]()
![]()
139. Arising from the National Competition Policy of the 1990s and the National Reform Agenda of the first decade of this century: PC (2006, Chapters 6 and 7).
141. Infrastructure Victoria (2020).
142. Infrastructure Australia (2019, p. 50).
For instance, if dilapidated wooden bridges were replaced with steel bridges, they would be able to handle B-double semi-trailers which currently have to take circuitous routes instead.143 NSW’s pinch point program aims to unclog traffic bottlenecks by improving the capacity of the road network without needing to build new roads.144
Smaller projects generally have higher benefit cost ratios.145 They are more robust to a range of future scenarios, such as the fall in population growth caused by the pandemic response (Section 1.2.1). Keeping options open, particularly in a time of high uncertainty, is a smart strategy.

It is a long way from these infrastructure projects to the $1 billion-plus megaprojects, let alone the $5 billion-plus mega megaprojects. Rather than reaching for the heroic and the iconic megaproject, governments should focus on upgrading and improving existing infrastructure.
6.2 Use better tools for estimating costs
Cost estimates made early in the life of a project are necessarily less precise than later ones.
A good estimate has four attributes: it should be close to the true value; it should be unbiased, with successive estimates not deviating
consistently from the true value in a single direction; it should be well calibrated, meaning that the range of the cost estimate’s uncertainty interval frequently includes the true value; and it should be reliable, in the sense that an expert’s estimates can be repeated by others.146
For an estimate to have these attributes, the estimator needs two things: adequate data, and a clear understanding of how to use it in constructing the estimate. But, as the following sections explain, the data available in Australia is far from adequate, and there are shortcomings in the official guidance on cost estimation.
6.2.1 A fundamental gap is data on completed projects
Experts in cost estimation are calling for, and should get, better data.
Road experts from all jurisdictions are recommending a cross- jurisdictional database of final project costs and what gave rise to them.147 It should be established. Minor variations in how state and territory governments select and procure infrastructure projects are insignificant when compared with the value of being able to learn from a large pool of projects generated by very similar processes. Such data would help specialists to develop better cost estimates at early stages of a project.
The database should contain sufficient information to enable experts to contextualise costs, such as project type, site, materials, utilities, environmental mitigation costs, and techniques. To do their job properly, experts also need:148
direct costs from contractor, client-side project management/ stake- holder engagement/ environmental costs, costs arising from unfore- seen risks, and contingencies . . . important categories of costs like utilities relocation that can have a significant impact on costs.
![]()
143. Potter (2020).
144. Transport for NSW (2020).
145. Infrastructure Australia (2019, p. 298).
![]()
146. DIRDC (2018, pp. 16–17).
147. Chowdhury et al (2020, p. 32).
148. Ibid (p. 32).
The Department of Infrastructure, Regional Development and Cities agrees. It has pointed to the challenges a cost estimator may face – key among them being ‘not having access to historical cost databases’ of the kind that are available to their US and European counterparts.149
This is not a new problem. In 2014, the Productivity Commission called for strategic benchmarking data, including costs per major unit, using a standard cost breakdown, and average expenditures over the construction period. The commission envisaged that this information would be required for any infrastructure project where there was a Commonwealth funding component, and that it would be independent of both government and industry influence.150 Benchmarking data would complement the detailed data called for by cost estimation specialists, enabling a ‘top down’ view alongside the ‘bottom up’ view of detailed historical cost data.
Grattan Institute, too, has called for better data to assist cost estimation. In 2016, we recommended that the Commonwealth seek the cooperation of the states to create new benchmarking data to improve risk measurement in new project proposals.151 We also recommended that the Commonwealth put to use the post-completion reports that states are already required to provide as a condition of their final milestone payment, by aggregating the data into a useful product.
Despite widespread understanding of the scarcity of data, it seems that almost nothing has happened since then.
The only progress has been a first step on the path towards achieving a benchmark series of construction costs per lane kilometre for roads.
![]()
149. DIRD (2017, p. 8).
150. PC (2014, pp. 47–48).
151. Terrill and Danks (2016, pp. 7–8).
The Bureau of Infrastructure, Transport and Regional Economics conducted a pilot study in 2015 of 45 road projects and a 2017 update of 32.152 This work was carried out at the request of the Transport and Infrastructure Council of the Council of Australian Governments,153 which commissioned the work in response to recommendations of the Productivity Commission’s inquiry.154 The bureau’s findings were interesting and suggestive, but limited by the small sample size and lack of detail (Figure 6.1 on the next page). The bureau recommended that the benchmarking be repeated in 2019 – which did not happen.155
Lack of data is showing up today in insufficient provision for ‘worst case’ cost outcomes
One clear manifestation of the scarcity of data is that the cost estimates of current projects continue to make insufficient provision for ‘worst case’ outcomes.
Business cases typically include an estimate of the the median cost, or ‘P50’, and the worst case, or ‘P90’.156 In business cases produced in recent years, the difference between P50 and P90 cost estimates is generally about 7 per cent (Table 6.1 on page 40). But the experience
of the past two decades has shown that the difference between the P50 and P90 costs is actually 49 per cent, on average.157
This difference between usual cost estimation practice and observed reality would be unlikely to occur were a cross-jurisdictional database of final project cost outcomes available to estimators. Such a database would indicate that large cost overruns are far more frequent than recent cost models imply.
This comparison of cost estimation practice and actual experience shows that either median cost estimates are generally too high, or – more likely – ‘worst case’ cost estimates are generally too low.158 Cost estimates are making insufficient allowance for unlikely events that cause large cost overruns. Part of the reason for this is likely to be that most cost estimation methods recommended in guideline documents and handbooks do not include the costs of any unknown risks not explicitly identified by the estimator (see Appendix B).
The P90 estimate for the West Gate Tunnel in the 2015 business case was $5.548 billion, 6.2% higher than the P50 estimate. Were this
P90 estimate correct, it would indicate that there is only a 10 per cent probability that the eventual project costs would exceed $5.548 billion. As shown in Section 1.1.1 on page 8, the current cost estimate is $6.7 billion, and there are reports that costs could further blow out.159 Given this situation, it seems unlikely that the P90 estimate of $5.548 billion took sufficient account of unlikely adverse events.
There is a pressing need for better data.
Figure 6.1: Road costs vary widely across jurisdictions
Average cost per lane km, $ million
 0
5
10
15
20
0
5
10
15
20
Principal rural highway
Major rural road
Urban freeway
Urban arterial
Notes: Costs per lane kilometre exclude property acquisition and supplementary costs. BITRE randomly assigned responding jurisdictions a number between 1 and
7. Tasmania did not provide data in 2017. Source: BITRE (2018, Table R.B3, p. 26).
![]()
158. In fact, it is clear that relying on median cost estimates will systematically understate the cost of the portfolio of projects. This is because the distribution of cost estimates is right-skewed, and therefore the mean, or expected value, is greater than the median cost estimate. More detail on the distribution of cost estimates is in Appendix B.
159. Jacks (2020).
![]()
Table 6.1: The difference between median and ‘worst case’ cost estimates is lower, on average, than experience suggests it should be
Cost estimate (nominal, $millions)
|
Project |
State |
Median |
‘Worst case’ |
Difference |
|
Inland Rail |
National |
$9,889 |
$10,657 |
7.8% |
|
Metro Tunnel |
Vic |
$10,154 |
$10,837 |
6.7% |
|
West Gate Tunnel |
Vic |
$5,226 |
$5,548 |
6.2% |
|
Canberra Light Rail |
ACT |
$759 |
$806 |
6.2% |
|
Bruce Highway – Cairns Southern Access Corridor (Stage 3) |
QLD |
$470 |
$500 |
6.4% |
|
Bruce Highway – Cairns Southern Access Corridor (Stage 4) |
QLD |
$97 |
$104 |
7.2% |
|
M1 Pacific Motorway – Eight Mile Plains to Daisy Hill |
QLD |
$713 |
$747 |
4.8% |
|
M1 Pacific Motorway – Varsity Lakes to Tugun |
QLD |
$960 |
$1,017 |
5.9% |
|
Townsville Eastern Access Rail Corridor |
QLD |
$369 |
$392 |
6.2% |
|
Benefit Cost Ratio |
||||
|
|
|
Median |
‘Worst case’ |
Difference |
|
Beerburrum to Nambour Rail Upgrade |
QLD |
1.48 |
1.35 |
9.6% |
|
Bruce Highway – Deception Bay Road Interchange |
QLD |
3.23 |
3.03 |
6.6% |
|
Bruce Highway – Maroochydore Interchange |
QLD |
3.4 |
3.2 |
6% |
|
Bruce Highway – Bribie Island Road to Steve Irwin Way |
QLD |
2.02 |
1.91 |
5.8% |
|
Centenary Bridge Upgrade |
QLD |
0.85 |
0.75 |
13% |
|
Smithfield Transport Corridor Upgrade |
QLD |
2.9 |
2.6 |
11% |
Average difference of above estimates 7.3%
Average actual difference across all projects completed in the past 19 years 49%
![]()
Notes: Public business case documents for the last six projects in the table do not explicitly include median and ‘worst case’ cost estimates on a comparable basis. They do, however, include benefit cost ratios estimated using median and ‘worst case’ cost estimates. The relevant difference between these benefit cost ratios is equal to the ratio between median and ‘worst case’ cost estimates, inflated and discounted, including operational costs. Operational costs are typically less than 6 per cent of capital costs for these projects.
Sources: ARTC (2015, p. 19), Victorian Department of Economic Development, Jobs, Transport and Resources (2016, p. 9), Victorian Government (2015, p. 211), Capital Metro Agency (2014, p. 86), Building Queensland (2017a, p. 4), Building Queensland (2017b, p. 3), Building Queensland (2018a, p. 3),
Building Queensland (2018b, p. 3), Building Queensland (2017c, p. 131), Building Queensland (2016, pp. 12–13), Building Queensland (2018c, p. 9), Building Queensland (2018d, p. 9), Building Queensland (2018e, p. 10), Building Queensland (2019, p. 10), Building Queensland (2017d, pp. 13–14), and Grattan analysis of Deloitte Access Economics Investment Monitor.
6.2.2

A proliferation of cost estimation handbooks adds unnecessary complexity
In 2016, we at Grattan Institute were startled to discover there were more than 50 current guideline documents and handbooks on how to estimate project costs in Australia. Four years later, not much has changed: seven guidance documents have been retired, but another five have sprung up in their place (Figure 6.2).
![]()
 Figure
6.2: There
are 55
guides in
Australia for
estimating the
cost of transport
infrastructure projects
Figure
6.2: There
are 55
guides in
Australia for
estimating the
cost of transport
infrastructure projects

![]()
2016 2020
Source: Grattan analysis of Australian Commonwealth and state guidance.
Ultimately, all cost estimates use some combination of four tools: expected value, sensitivity analysis, probability pricing, and reference class forecasting, often referred to as benchmarking or validation (see Appendix B). But the handbooks that are current today present these same basic tools in a wide variety of ways, and they are inconsistent in terms of which tools they recommend, and in how they guide the user through the relationships among the various tools.
It is not obvious why Australian jurisdictions need different approaches to the same basic tools. Not only are the core tools presented in inconsistent ways, but the data that would be required to use the tools properly is not available to cost estimators. In particular, probability pricing and reference class forecasting rely on historical cost outcomes.
It would be prudent for governments embarking on megaprojects, with the associated complexity and risk, to ensure a high competency
standard for those involved; for instance, registration as a cost engineer or risk engineer.
6.3 Learn from history
There is an element of chance to any individual project finishing on
that cost underruns were anywhere near as common or as large as cost overruns.
But overruns are much more common and much larger than underruns. The reasons are not a mystery – as this report has shown, large projects are more prone to overruns and to larger overruns; also prematurely announced projects are more prone to overruns, which
are often larger too.
The following sections point to two other predictors of overruns: broader market conditions, and contract type.
6.3.1 Take advantage of cyclical conditions
While the number and size of cost overruns well and truly eclipses the number and size of cost underruns, the six largest underruns since the beginning of 2001 all occurred on projects completed since the
beginning of 2015. In that period, 12 per cent of projects finished below their first announced cost, compared to 9 per cent in the 14 years before.
Similarly, cost overruns were less frequent and smaller on average in the period from 2015 to 2018 than the long-term averages – although the trend was not sustained into 2019.
This potentially promising trend to smaller overruns and more underruns appears, at least in part, to have resulted from favourable cyclical conditions. According to the International Monetary Fund, individual projects can cost 10-to-15 per cent more simply because they are built at a time of particularly high public investment.160
The period of fewer and smaller overruns since 2015 may have reflected
an unexpected
flattening in
costs in
the preceding
years (Figure
6.3 on the
next page). Initial cost estimates would have
budget. It
would therefore
be fair
to argue
that imperfect
cost
estimates simply
reflect the
difficulty of
the cost
estimation task
– if
it were
true assumed that recently-observed growth in prices in the construction market
would continue in the near future. If that growth did not eventuate, and
prices flattened, bids for tenders may have come in lower than expected,
leading to projects contracted or constructed at lower-than-expected costs
between late 2013 and late 2016. And a number
of these
projects would
have been
completed from
about 2015
onwards.
Figure 6.3: Transport construction costs were broadly flat between late 2013 and late 2016
Producer Price Index, road and bridge construction, Australia
120
These market conditions probably also led to a period of more frequent and larger underruns.
A major factor in this increase in underruns appears to have been conditions in the construction market as the mining boom wound down. In late 2014, it was reported that ‘the cost of building projects has fallen by up to 50 per cent as construction firms desperately seek work after the end of the mining boom’.161 The then Minister for Infrastructure and Regional Development, Warren Truss, was quoted as saying:162
What we have found is that when we have been calling tenders for projects over the last 12 months or so, we are getting prices sometimes as low as half the cost that we were being asked to pay three or four years ago, or maybe two or three years ago. . . Almost universally now tenders are coming in under our estimates, and projects are being completed under our estimates.
These conditions were still prevailing almost two years later, when BIS Shrapnel reported that its monitoring of major projects was revealing ‘more projects where the winning bid is much lower than what was initially budgeted (and expected) by governments’.163 The BIS Shrapnel report noted the example of the Cooroy to Curra: Section C project on the Bruce Highway. Originally estimated to cost $624 million, it was contracted in February 2016 for $384 million.164
Another Queensland project contracted around the same time, Stage 2 of the Gold Coast Light Rail, had a similar experience. The total cost of the project had been reported as $700 million in December 2015.165 But when the contracts were awarded in March 2016, the cost had dropped to $420 million.166
We’d expect prices in a market to fall as demand does. But even in the specific example of the market for infrastructure construction, where prices reflect – among other things – the risk that something might be more costly to build than expected, contractors are willing to take on a given level of risk for a lower price if there is less work around.167
The implication of this finding on more and larger cost underruns, along with fewer and smaller cost overruns, is that there are potentially material value-for-money gains if governments take care and a medium-term view on the timing and rate at which they introduce new projects to the market. This indicative finding warrants more detailed analysis by governments.
6.3.2 Analyse the cost outcomes of different contract types
There is lively debate at present about the allocation of risk between
government and the firms it contracts with to construct public
infrastructure. In particular, many industry players are unhappy with the
risk allocation
inherent in
proposals going
to market:
‘John Holland will no
longer bid on projects where it believes the risk profile is unacceptable,’
its CEO, Joe Barr, said in March 2020.168
Australian governments allocate risks among the parties through the choice of contract type, and the precise terms of the contract. The Public Private Partnership, or PPP, model is widely used because it allocates additional risk to the private sector.169 The risk allocation comes at a cost, of course, the idea being that PPPs can result in lower costs than traditional delivery models if the additional commercial discipline is greater than the higher costs of private capital that PPPs incur.
We have been unable to analyse the impact of contract type on cost outcomes for this report, due to the paucity of data available. There have been very few Australian studies of this question, and those that have been published have been limited by very small sample sizes.
Governments should invest more in understanding the patterns of outcomes of different contract types.
6.3.3 Publish post-completion reviews of big projects
Large public infrastructure projects are funded wholly or mostly by taxpayers. Therefore the community at large has a stake in knowing how projects turned out, whether costs were well managed, and whether the initial promises were delivered. But at present, information on project delivery is not presented in a clear way.
Post-completion reviews should be conducted on all big infrastructure projects. Infrastructure Australia requires them in its Assessment Framework,170 and has elevated them to a principle of infrastructure decision-making.171 The Commonwealth Department of Infrastructure,
Transport, Regional Development and Cities supports the notion that funding should be contingent upon proponents agreeing to
![]()
164. Rostron (2016a).
165. ABC News (2015).
166. Rostron (2016b).
167. Battley (2020).
168. Wiggins (2020b).
![]()
169. Hayford (2020b, p. 4).
170. Infrastructure Australia (2018b, pp. 38–41).
171. Infrastructure Australia (2018a, p. 3).

post-completion reviews,172 and has laid out how they should happen.173 The Productivity Commission wants them too.174
Post-completion reviews are a matter of routine elsewhere. For instance, England’s Post-Opening Project Evaluation analyses safety, cost, environmental impacts, accessibility, and integration with other local, regional, and national plans and programs. Norway’s post-opening evaluation of major projects examines the monetised costs and benefits, including construction costs, levels of demand, accidents, and local air pollution.175
But no matter how often it’s recommended in Australia that projects be evaluated post-completion, it almost never happens. Of large projects (costing more than $500 million) completed in the past four years, the only published post-completion report is for stage one of the Capital Metro light rail in Canberra.176
The lack of post-completion reviews reveals a desire by Australian governments to avoid accountability – and it amounts to a wasted opportunity to build internal capacity and learn from history.
172. DIRD (2016, p. 66).
173. DITCRD (2019, p. 20).
174. PC (2014, Recommendation 7.1).
175. Jong et al (2019, p. 77).
176. The Capital Metro Delivery Report includes a preliminary evaluation of benefits, and a revised estimate of the project benefit cost ratio: Transport Canberra (2019).
Appendix A: Methodological appendix
Many of the charts and much of the analysis in this report – in particular the analysis of cost overruns in Chapters 2 and 3 – use data on projects from the Deloitte Access Economics Investment Monitor. This appendix describes the Investment Monitor and how we prepared the data for analysis.
A.1 Deloitte Access Economics Investment Monitor
Since 2001, Deloitte Access Economics has routinely screened government budgets, announcements by private companies, the media, and other publicly available data sources to produce a quarterly snapshot of expected investment plans for each sector, including transport. We have linked the quarterly releases of the Investment Monitor from Q1 2001 to Q1 2020 to form a panel dataset that tracks the expected cost and degree of commitment to all publicly announced investment projects from first announcement through to completion.
A.2 The sample we used
Our sample consists of projects from the Investment Monitor that:
• are road or rail projects;
• had an initial expected cost of at least $20 million in nominal terms; and
• are ‘public’ projects.
We define a ‘public’ project as an investment by a government body in publicly accessible road or rail infrastructure. Our definition includes Public Private Partnerships (PPPs), but excludes investments by private operators of public infrastructure. The Investment Monitor has a variable indicating whether projects are public, private, or a PPP,
but we do not rely on this variable because it is incomplete and is not consistent with our preferred definition in some cases.
For our analysis of cost overruns, we considered only projects that had been recorded as ‘Completed’ in the Investment Monitor ’s historical database as at the end of March 2020. The historical database is a record of, among other things, the final cost and status of each project that leaves the Investment Monitor ’s quarterly ‘pipeline’.
For Figure 1.1 on page 5, Figure 1.2 on page 6, and Figure 4.1 on page 22, we considered only projects that had been recorded as ‘Completed’ or were still in the pipeline as at the end of March 2020. This removed some irregularities in the data relating to projects that do not appear to have been seen through to completion.
A.3 How we compared the costs of projects that occurred at different times
The Investment Monitor generally records the expected and final cost of a project in nominal, outturn dollars. To compare the costs of
projects that occurred at different times, we adjusted costs for inflation using the Australian Bureau of Statistics’s Producer Price Index for road and bridge construction (Index Number 3101).177 Although this index does not include railway construction, we considered it a more
appropriate index of transport construction costs than its parent indices, which include many non-transport construction activities.178
![]()
177. ABS (2020c, Table 17).
178. We consider our approach here to be an improvement on that in our 2016 report, Cost overruns in transport infrastructure, where we adjusted for inflation using Index Number 30 ‘Building construction’.
We assume that the distribution of project costs across time is the same for all projects, and we convert nominal outturn costs to Q1 2020 dollars from the middle year of the period during which each project was under construction. While only approximate, this approach is sufficient for controlling for the effect of inflation at the aggregate level under the assumption that the distribution of project costs over the construction period does not vary with time. Importantly, the inflation adjustment procedure does not affect the estimates of the size of cost overruns in this report, only the relative size of projects that are constructed in different periods.
A.4 How we checked ‘outliers’
In the first instance, we measured cost overruns over the life of a project as the final cost in the historical database minus the first cost estimate that appeared in the quarterly pipeline (i.e. the initial cost).179 We then verified the initial cost, first cost when committed, first cost when under construction, and final cost, of the projects with the largest changes between initial and final costs (both overruns and underruns). This was to provide assurance that the largest cost changes in our analysis were not driven by erroneous datapoints or an artefact of how a project and its costs had been recorded over time in the Investment Monitor.
It was beyond our resources to research the cost histories of all 683 completed, public road and rail projects in our sample. Therefore, we restricted our checking in the first instance to the 54 projects whose final cost was at least $250 million (in $2020) higher or lower than their initial cost. This threshold was chosen somewhat arbitrarily as the level at which a tractable amount of research and checking would account for the vast majority (almost 80 per cent) of the total value of cost changes.
Having done these checks and correcting costs where appropriate, we performed a second round of checks. This involved checking costs of projects for which the change in cost as a percentage of initial cost was outside the range of percentage cost changes on projects that were looked at in the first round of checking. Such ‘outliers’ were checked progressively until no project in the sample had a percentage change in cost that was outside the range of those checked. This process resulted in an additional 10 projects having their costs checked.180
Of the 64 projects we reviewed in total, we revised the initial cost of 34 and the final cost of 17. These changes resulted in a 1 per cent decrease in the total initial costs of these 64 projects, and a 4 per cent decrease in the final costs.
In many cases we needed to change cost estimates because:
• the fundamental purpose of the project changed over time (see Box 2 on page 15); or
• components of the project were added or subtracted to the project record in the Investment Monitor over time (e.g. a record may have begun life in the Investment Monitor relating to an entire project, but at some point in time changed to relating to a single stage of the project only – or vice-versa).
These issues arise because we have linked into a time series a dataset (the Investment Monitor ) which is intended to be looked at as a quarterly snapshot.
![]()
![]()
179. ‘True’ overruns will be probably underestimated to the extent that projects had early cost estimates that were missed in the compilation of the Investment Monitor, including because such estimates were announced prior to commencement of the Investment Monitor in 2001.
180. Our treatment of outliers in this report differs to that in our 2016 report. In the 2016 report we simply excluded projects with percentage cost changes outside the range observed on a smaller sample of projects that we manually collated: Terrill and Danks (2016, pp. 64–65).
Appendix B: Risk appendix
The cost estimation handbooks that are current today generally recommend some combination of four tools: expected value, sensitivity analysis, probability pricing, and reference class forecasting, often referred to as benchmarking or validation.
The first three tools involve the estimation of particular statistics, or characteristics of the distribution of potential costs. Reference class forecasting is a method for estimating the overall distribution.
Figure B.1: Key risk measurement and management concepts
Illustrative probability distribution of cost outcomes on individual projects
 Full
distribution
Full
distribution
The expected value of a project’s cost is the average or mean cost of a project. It is calculated by assigning a single probability to each potential cost outcome, and multiplying this probability by the cost of that particular outcome if it did occur. This is the simplest approach to estimating the likely size of cost overruns. Its main shortcoming is that it does not include the costs of any unknown risks not explicitly identified by the estimator.
Sensitivity analysis assesses the range within which a cost estimate is likely to vary. It involves specifying the range of values that critical inputs to project cost estimates could take, and estimating how much the project would cost if the inputs were to take these values. Like the expected value methodology, it does not deal with unknown risks not explicitly identified by the estimator.
Probability pricing identifies how large a project budget needs to be to accommodate a specific probability that the project will be completed within budget. For instance, most projects have ‘P50’ (or median) and
‘P90’
(or ‘worst
case’) cost
estimates, which
identify the
prices for
which it is expected that a project will meet or better its budget in
50 per cent or 90 per cent of cases respectively.
Notes: The distribution of cost risk depicted is a stylized representation of the distribution of cost overruns. This chart illustrates the relative distances between key points of the distribution.
Reference class forecasting, often referred to as benchmarking or validation, compares cost estimates for one project to those on
similar projects that have already been built. The average size of cost overruns observed across the sample can be used as an estimate of the expected value of cost overruns; the variance of the outcomes on the comparison projects can be used to understand the range within which a cost estimate is likely to vary; and the different points within the observed distribution can be used to estimate probability prices.
Reference class forecasting incorporates the likely costs of unknown risks and does not suffer from optimism bias, because it relies on objective historical information. Its main shortcoming is that it does not account for the ways in which a project’s risk profile is unique.
Figure B.1 on the preceding page illustrates these tools for the costs of a group of completed projects: expected value (or mean); variance (assessed by sensitivity analysis); and probability pricing levels. The fourth tool, reference class forecasting, offers a way to improve the quality of expected value, sensitivity analysis, and probability pricing by relying on experience.
Bibliography
ABC News (2011). “O’Farrell hails new political landscape”. ABC News. https://www.abc.net.au/news/2011-03-27/ofarrell-hails-new-political- landscape/2642320.
Andrews, D. (2017). North East Link – Victoria’s Biggest Ever Transport Project. https://www.premier.vic.gov.au/north-east-link-victorias- biggest-ever-transport-project/.
(2015). “Gold Coast light rail gets $95m federal funding boost in time
for 2018 Commonwealth Games”. ABC News. https://www.abc.net.au/news/2015-10-11/gold-coast-light-rail-gets- 95m-federal-funding-boost/6844704.
(2018). Underground Suburban Rail Loop To Connect Victoria. https://www.premier.vic.gov.au/underground-suburban-rail-loop- connect-victoria.
ABS (2020a). Labour Force, Australia, Detailed, Aug 2020. Cat. 6291.0.
Australian Bureau of Statistics. https://www.abs.gov.au/statistics/labour/employment-and- unemployment/labour-force-australia-detailed.
(2020b). Migration, Australia, 2018-19. Cat. 3412.0. Australian Bureau of Statistics. https://www.abs.gov.au/statistics/people/population/migration- australia/latest-release.
(2020c). Producer Price Indexes, Australia, Mar 2020. Cat. 6427.0.
Australian Bureau of Statistics. https://www.abs.gov.au/statistics/economy/price-indexes-and- inflation/producer-price-indexes-australia/mar-2020.
Adept Economics (n.d.). Demystifying Brisbane’s Cross-River Rail: a PPP, an alliance, and a traditional procurement. https://adepteconomics.com.au/demystifying-brisbanes-cross-river- rail-a-ppp-an-alliance-and-a-traditional-procurement/.
AECOM (2020). Sydney Metro Northwest. https://aecom.com/au/projects/sydney-metro-northwest/.
Albanese, A. (2020). Australia beyond the coronavirus. Fifth vision statement speech. https://anthonyalbanese.com.au/anthony-albanese-speech- australia-beyond-the-coronavirus-canberra-monday-11-may-2020.
ARTC (2010). Melbourne–Brisbane Inland Rail Alignment Study. Australian
Rail Track Corporation. http://www.artc.com.au/library/IRAS_Final%20Report.pdf.
(2015). Inland Rail 2015: ARTC 2015 Inland Rail Programme Business Case. Australian Rail Track Corporation. https://s3-ap- southeast-2.amazonaws.com/ehq-production-australia/5de589d b79424a8f1344e2e42e171fc205104b99/documents/attachments/000/ 029/855/original/InlandRailBusinessCase.pdf?1448785278.
Audit Office of New South Wales (2016). CBD and South East Light Rail Project. https://www.audit.nsw.gov.au/our-work/reports/cbd-and- south-east-light-rail-project.
(2020). CBD and South East Light Rail: follow-up performance audit. https://www.audit.nsw.gov.au/our-work/reports/cbd-and-south-east- light-rail-follow-up-performance-audit.
Australian Associated Press (2016). “Labor demands audit of govt projects”. news.com.au. https://www.news.com.au/national/breaking- news/labor-demands-audit-of-govt-projects/news- story/817232912465ba7900ea099dbbc36674.
Battley, T. (2020). “Infrastructure: an increasingly risky business”. AECOM. https://infrastructure.aecom.com/2020/funding-infrastructure-an- increasingly-risky-business.
Baxendale, R. (2020). “Melbourne Metro rail tunnel cost blowouts under scrutiny”. The Australian. https://www.theaustralian.com.au/nation/politics/melbourne-metro- rail-tunnel-cost-blowouts-under-scrutiny/news- story/cc570ec9f4feeea1b74b3f93b36b6317.
Beck et al (2020). Beck, M. J., Hensher, D. A. and Wei, E. “Slowly coming out of COVID-19 restrictions in Australia: Implications for working from home and commuting trips by car and public transport”. Journal of Transport Geography 88 (102846). https:
//www.sciencedirect.com/science/article/pii/S0966692320307122.
Beech, J. (2015). “Metro to reshape stations on route”. English.
Canterbury-Bankstown Express, p. 8. https://www.dailytelegraph.com.au/newslocal/northern- beaches/bankstown-and-punchbowl-train-stations-on-track-for- upgrade-as-part-of-sydney-metro-project/news- story/6b3ee22c34d05e6f73c7765701c9f169.
BITRE (2018). Road construction cost and infrastructure procurement benchmarking: 2017 update. Bureau of Infrastructure, Transport and Regional Economics. https://www.bitre.gov.au/sites/default/files/rr148.pdf.
Black, J. (2014). “Traffic risk in the Australian toll road sector”. Public Infrastructure Bulletin, pp. 18–29. https:
//www.semanticscholar.org/paper/Traffic-risk-in-the-Australian-toll- road-sector-Black/80142c0791dd6ff67f7cc2f3c1ec7580d8c34894.
Bligh, A. (2008). Premier gives the green light to Australia’s largest road project. Media statement. https://web.archive.org/web/20091026223010/http://www.cabinet.qld. gov.au/MMS/StatementDisplaySingle.aspx?id=58107.
Brady, S. (2019). Review of all fatal accidents in Queensland mines and quarries from 2000 to 2019. Prepared for the Department of Natural Resources, Mines and Energy. Brady Heywood Pty Ltd. https://www.parliament.qld.gov.au/documents/tableOffice/TabledPape rs/2020/5620T197.pdf.
Brennan, M. (2020). The COVID-19 recovery: a view from the supply side.
Speech to the Australian Business Economists. https://www.pc.gov.au/news-media/speeches/covid-recovery.
Brisbane City Council (2004). North-South Bypass Tunnel - Stage 1, Phase 2 - Feasibility Study: Initial advice statement. https://www.statedevelopment.qld.gov.au/resources/project/clem- jones-tunnel/north-south-bypass-tunnel-ias.pdf.
Budd, H. (2013). “M2 widening nears completion and designs for $10 billion WestConnex project set for release”. Daily Telegraph. https://www.dailytelegraph.com.au/news/nsw/m2-widening-nears- completion-and-designs-for-10-billion-westconnex-project-set-for- release/news-story/ae0c993d00184b8d8d34ee61759dbc83.
Building Queensland (2016). Beerburrum to Nambour rail upgrade: Detailed Business Case 2016: Cost benefit analysis summary. https://buildingqueensland.qld.gov.au/wp- content/uploads/2018/07/B2N-Cost-Benefit-Analysis-Summary.pdf .
(2017a). Bruce Highway - Cairns Southern Access Corridor Stage 3 - Edmonton to Gordonvale: Detailed Business Case 2017: Cost benefit analysis summary. https://buildingqueensland.qld.gov.au/wp- content/uploads/2018/11/E2G-cost-benefit-analysis-summary.pdf.
(2017b). Bruce Highway - Cairns Southern Access Corridor Stage 4 - Kate Street to Aumuller Street: Detailed Business Case 2017: Cost benefit analysis summary. https://buildingqueensland.qld.gov.au/wp- content/uploads/2018/11/K2A-cost-benefit-analysis-summary.pdf.
(2017c). Townsville Eastern Access Rail Corridor: Detailed Business Case. https://buildingqueensland.qld.gov.au/wp- content/uploads/2018/04/TEARC-Detailed-Business-Case-1.pdf.
(2017d). Smithfield transport corridor upgrade project: Cost benefit analysis summary. https://buildingqueensland.qld.gov.au/wp- content/uploads/2018/02/Smithfield-Transport-Corridor- Upgrade_CBA.pdf.
Building Queensland (2018a). M1 Pacific Motorway - Eight Mile Plains to Daisy Hill (EMP2DH): Detailed Business Case 2018: Business case / Cost benefit analysis summary. https:
//buildingqueensland.qld.gov.au/wp-content/uploads/2019/02/M1- Eight-Mile-Plains-to-Daisy-Hill-summary.pdf.
(2018b). M1 Pacific Motorway - Varsity Lakes to Tugun (VL2T): Detailed Business Case 2018: Business case / Cost benefit analysis summary. https://buildingqueensland.qld.gov.au/wp- content/uploads/2019/02/MI-Varsity-Lakes-to-Tugun-summary.pdf.
(2018c). Bruce Highway - Deception Bay Road interchange upgrade project: Detailed Business Case 2018: Business case / cost benefit analysis summary. https://buildingqueensland.qld.gov.au/wp- content/uploads/2018/05/Bruce-Highway-Deception-Bay-Road- Interchange.pdf.
(2018d). Bruce Highway - Maroochydore interchange project: Detailed Business Case 2018: Business case / cost benefit analysis summary. https://buildingqueensland.qld.gov.au/wp- content/uploads/2018/06/Bruce-Highway-Maroochydore- Interchange.pdf.
(2018e). Bruce Highway - Caboolture-Bribie Island Road interchange to Steve Irwin Way interchange: Detailed Business Case 2018: Business case / cost benefit analysis summary. https:
//buildingqueensland.qld.gov.au/wp-content/uploads/2018/06/Bruce- Highway-Caboolture-Bribie-Island-Road-to-SIW.pdf.
(2019). Centenary Bridge upgrade project: Business case / cost benefit analysis summary. https://buildingqueensland.qld.gov.au/wp-
Caldwell, F. (2018). “Trad slams snub of Cross River Rail by Infrastructure Australia”. Brisbane Times. https:
//www.brisbanetimes.com.au/politics/queensland/trad-slams-snub-of- cross-river-rail-by-infrastructure-australia-20180327-p4z6gb.html.
Capital Metro Agency (2014). Capital Metro Full Business Case. https://www.cityservices.act.gov.au/ data/assets/pdf_file/0010/ 887680/Light-rail-Capital-Metro-Business-Case-In-Full.pdf.
Carey, A. (2018). “Rail pledge makes claim to take politics out of planning sound hollow”. The Age. https://www.theage.com.au/politics/victoria/rail-pledge-makes-claim- to-take-politics-out-of-planning-sound-hollow-20180829-p500jj.html.
Chesterton, A. (2008). “The new $152m light rail plans for Sydney - Proposals for extending the network through city and further into inner west are on the right track”. Sunday Telegraph. 6 April.
Chowdhury et al (2020). Chowdhury, F., Naulls, A. and Smithers, J. Optimising project delivery performance. Austroads. https://austroads.com.au/publications/project-delivery/ap-r630- 20/media/AP-R630- 20_Optimising_Project_Delivery_Performance.pdf.
Collins, A. (2019). “Sydney Metro Northwest showcased as NSW election focus moves back to transport”. ABC News. https://www.abc.net.au/news/2019-03-19/sydney-metro-northwest- showcased-during-nsw-election/10915982.
Commonwealth of Australia (2017). Budget 2017-18: Budget Paper 1. https://archive.budget.gov.au/2017-18/bp1/bp1.pdf.
content/uploads/2019/11/Centenary_Bridge_CBA_Summary.pdf.
Caisley, O. (2019). “Frydenberg vows to tackle capacity constraints hampering
infrastructure projects”. The Australian.
https://www.theaustralian.com.au/nation/josh-frydenberg-rejects- state-push-to-bring-back-asset-recycling/news-
(2018). Final budget outcome 2017-18. https:
//archive.budget.gov.au/2017-18/fbo/FBO_2017-18_Combined.pdf.
(2019). Final budget outcome 2018-19. https://archive.budget.gov.au/2018-19/fbo/FBO_2018-19_web.pdf.
story/2147b64f5c81d6062d87450bec7acb98.
(2020a). Budget 2020-21: Budget Paper 1.
https://budget.gov.au/2020-21/content/bp1/download/bp1_w.pdf.
Commonwealth of Australia (2020b). Budget 2020-21: Budget Paper 2. https:
//budget.gov.au/2020-21/content/bp2/download/bp2_complete.pdf.
(2020c). Final budget outcome 2019-20. https://budget.gov.au/2019- 20/content/fbo/download/FBO-2019-20.pdf.
Coorey, P. (2019). “Infrastructure boom triggers cost blowouts: PM”. Australian Financial Review. https://www.afr.com/politics/federal/infrastructure- boom-triggers-cost-blowouts-pm-20190904-p52o18.
Coorey, P. and Cranston, M. (2020). “Spend big but don’t make whoopee, PM tells states”. Australian Financial Review. https://www.afr.com/politics/federal/spend-big-but-don-t-make- whoopee-pm-tells-states-20200814-p55lnz.
Council of Australian Governments (2020). Communiqué of the meeting of 13 March 2020. https://www.coag.gov.au/sites/default/files/communique/communique- 13-march2020.pdf.
Croagh, M. (2020). “A new deal for infrastructure in Australia?” LinkedIn. https://www.linkedin.com/pulse/new-deal-infrastructure-australia- matthew-croagh/.
Crockford, T. and Lynch, L. (2020). “Cross River Rail board to be sacked as Minister takes the reins”. Brisbane Times. https://www.brisbanetimes.com.au/national/queensland/cross-river- rail-board-to-be-sacked-as-minister-takes-the-reins-20200226- p544eu.html.
DIRD (2016). The Australian Government’s Response to Infrastructure Australia’s Australian Infrastructure Plan. Department of Infrastructure and Regional Development. https:
//www.infrastructure.gov.au/infrastructure/publications/files/Australian- Government-Response-to-Australian-Infrastructure-Plan_Nov- 2016.pdf.
(2017). Guidance note 2: base cost estimation. Department of Infrastructure and Regional Development. https://investment.infrastructure.gov.au/files/cost_estimation_guidanc e/Guidance_Note_2_Base_Cost_Estimation.pdf.
DIRDC (2018). Guidance note overview. Department of Infrastructure, Regional Development and Cities. https://investment.infrastructure.go v.au/files/cost_estimation_guidance/Overview-Version-1.0.pdf.
DITCRD (2019). Notes on administration for land transport infrastructure projects 2019-2024. Administrative detail to support the National Partnership Agreement on land transport infrastructure projects. Department of Infrastructure, Transport, Cities and Regional Development. https:
//investment.infrastructure.gov.au/files/notes_on_administration/final- notes-on-administration.pdf.
Edwards, J. (2017). “Melbourne’s West Gate Tunnel project cost blows out by
$1.2b”. ABC News. https://www.abc.net.au/news/2017-12- 12/melbournes-west-gate-tunnel-project-cost-blows-out/9248994.
Elks, S. (2020). “QLD Labor’s $5.4bn Cross River Rail project receives 150 safety warnings over asbestos, hazardous chemicals and heights”. The Australian. https://www.theaustralian.com.au/nation/qld-labors- 54bn-cross-river-rail-projects-receives-150-safety-warnings-over- asbestos-hazardous-chemicals-and-heights/news- story/3c2a790f8f02ad1f906a040392a86f46.
Elks, S. and Williams, P. (2020). “Queensland’s $5.4bn warning shot on Brisbane Cross River Rail project”. The Australian. https://www.theaustralian.com.au/nation/queensland-government- seizes-control-of-cross-river-rail-project-amid-contractor- concerns/news-story/b3844fd1eb46b47add1d13ad94259bf4.
Flyvbjerg, B. (2014). “What you should know about megaprojects and why: an overview”. Project Management Journal, https://papers.ssrn.com/sol3/papers.cfm?abstract_id=2424835.
Fox, J. and King, G. (2018). “Is the $50 billion Melbourne suburban rail loop the answer for congestion and housing?” The Real Estate Conversation. https://www.therealestateconversation.com.au/news/2018/08/31/the- 50-billion-melbourne-suburban-rail-loop-the-answer-congestion-and- housing.
Freed, J. (2014). “Truss sees infrastructure tenders at half the price”. Sydney Morning Herald. https://www.smh.com.au/business/truss-sees- infrastructure-tenders-at-half-the-price-20141015-1169pk.html.
Galloway, A. (2016). “Andrews government commits to building $10 billion North East Link”. Herald Sun. https://www.heraldsun.com.au/news/victoria/andrews-government- commits-to-building-10-billion-north-east-link/news- story/11189d8bbba7f37feca2a8590371059d.
Glaeser, E. (2016). “If you build it...: myths and realities about America’s infrastructure spending”. City Journal.
https://www.city-journal.org/html/if-you-build-it-14606.html.
Hosking, W. (2020). “How suburban rail loop will change your suburb”. Herald Sun. https://www.heraldsun.com.au/news/victoria/how-suburban-rail- loop-will-change-your-suburb/news- story/38cf4068665ea8c6c5c83659fc101c0f.
IMF (2020). Fiscal monitor: policies for the recovery. International Monetary Fund. https:
//www.imf.org/en/Publications/FM/Issues/2020/09/30/october-2020- fiscal-monitor#Full%20Report%20and%20Executive%20Summary.
Infrastructure Australia (2016). Project Business Case Evaluation - Inland Rail. https://www.infrastructureaustralia.gov.au/sites/default/files/2019- 08/final_inland_rail_project_evaluation_summary_0.pdf.
Gordon, P. (2020). “Brisbane’s $5.4 Billion Cross River Rail”. Investo Property.
https://www.investoproperty.com.au/brisbanes-5-4-billion-cross-river- rail.
Harris, R. and Galloway, A. (2019). “Prime Minister Scott Morrison to
announce $2b fast rail between Melbourne and Geelong”. Herald
Sun. 21 March. https://www.heraldsun.com.au/news/victoria/prime-minister-scott- morrison-to-announce-2b-fast-rail-between-melbourne-and-
(2017). Project Evaluation Summary: Cross River Rail. Infrastructure Australia. https://www.infrastructureaustralia.gov.au/sites/default/files/2019- 06/20170727-Cross-River-Rail-Summary.pdf.
(2018a). Infrastructure decision-making principles. https://www.infrastructureaustralia.gov.au/sites/default/files/2019- 06/Infrastructure_Decision-Making_Principles.pdf.
geelong/news-story/c65aafa25d69b30cc766796d67f75de8.
Hart, A. (2016). “Is the window closing for lower cost infrastructure investment?” LinkedIn. https://www.linkedin.com/pulse/window- closing-lower-cost-infrastructure-investment-adrian-hart/.
Hayford, O. (2020a). Rebalancing risk allocation on infrastructure projects.
DLA Piper. https://www.dlapiper.com/en/australia/insights/publication s/2020/08/rebalancing-risk-allocation-on-infrastructure-activity/.
(2020b). Improving public private partnerships - lessons from Australia. DLA Piper. https://www.dlapiper.com/en/australia/insights/publications/2020/05/ improving-public-private-partnerships---lessons-from-australia/.
(2018b). Assessment Framework.
https://www.infrastructureaustralia.gov.au/sites/default/files/2019- 06/infrastructure_australia_assessment_framework_2018.pdf.
(2019). The Australian Infrastructure Audit 2019. An assessment of Australia’s future infrastructure needs. https://www.infrastructureaustralia.gov.au/publications/australian- infrastructure-audit-2019.
(2020). Infrastructure Priority List. https://www.infrastructureaustralia.gov.au/sites/default/files/2020-02/ 2020%20Infrastructure%20Priority%20List%20HI%20resolution.pdf.
Infrastructure NSW (2020). Timely information on infrastructure projects - a guide. https://www.insw.com/expert-advice/timely-information-on- infrastructure-projects/.
Infrastructure NSW, TfNSW, and RMS (2012). WestConnex – Sydney’s next motorway priority. Infrastructure NSW, Transport for NSW, and Roads & Maritime Services. https://www.infrastructure.nsw.gov.au/media/1160/insw_tfnsw_and_r oads_and_maritime_services_wcx_25_sept_2012_final_120927.pdf.
Infrastructure Tasmania (2019). 30-Year Infrastructure Strategy. https://www.stategrowth.tas.gov.au/infrastructure_tasmania/30- year_infrastructure_strategy.
Infrastructure Victoria (2020). Fair Move: Better Public Transport Fares for Melbourne. https://www.infrastructurevictoria.com.au/wp- content/uploads/2020/09/Fair-Move-Better-Public-Transport-Fares- for-Melbourne-FINAL.pdf.
Jacks, T. (2020). “$3 billion overruns on West Gate Tunnel”. The Age. https://www.theage.com.au/national/victoria/3-billion-overruns-on- west-gate-tunnel-20200921-p55xkf.html.
Jacks, T. and Preiss, B. (2018). “State government announces massive suburban rail loop for Melbourne”. The Age. https:
//www.theage.com.au/national/victoria/state-government-announces- massive-suburban-rail-loop-for-melbourne-20180828-p5005r.html.
Jacks, T. and Danckert, S. (2019). “Metro Tunnel machines grind to halt in dispute over billions in cost blowouts”. The Age. https:
//www.theage.com.au/national/victoria/metro-tunnel-machines-grind- to-halt-in-dispute-over-3b-cost-blowouts-20191209-p53i2p.html.
Jacks et al (2019). Jacks, T., Koob, S. F. and Carey, A. “Morrison ‘can’t deliver’ Geelong rail plan for $4b, minister claims”. The Age. https://www.theage.com.au/politics/victoria/morrison-can-t-deliver- geelong-rail-plan-for-4b-minister-claims-20190322-p516i1.html.
Jacks, T. and Lucas, C. (2020). “Transurban asked to rip up West Gate Tunnel contract, court documents allege”. The Age. https:
//www.theage.com.au/national/victoria/transurban-launches-legal- action-against-west-gate-tunnel-s-builders-20200609-p550on.html.
Jacks, T. and Towell, N. (2020). “Deal cut on Metro Tunnel’s blowout billions after government ‘cave in’”. The Age. https:
//www.theage.com.au/national/victoria/deal-cut-on-metro-tunnel-s- blowout-billions-after-government-cave-in-20201015-p565a5.html.
John Holland (2020). Airport Link M7 & Northern Busway. https://www.johnholland.com.au/our-projects/airport-link-m7- northern-busway/.
Johnston et al (2019). Johnston, M., Campbell, J. and White, A. “Fears contaminated soil could put brakes on $6.7 billion road project”. Herald Sun. https://www.heraldsun.com.au/news/victoria/fears- contaminated-soil-could-put-brakes-on-67-billion-road-project/news- story/24ee9879100825fdbc461ecf42a47c9d.
Jones, A. (2019). “‘Full credit to Gladys’: Northwest Metro to open ahead of schedule and under budget”. 2GB.
https://www.2gb.com/full-credit-to-gladys-northwest-metro-to-open- ahead-of-schedule-and-under-budget/.
Jones, C. I. (2020). “The end of economic growth? Unintended consequences of a declining population”. National Bureau for Economic Research. http://conference.nber.org/conf_papers/f135902.pdf.
Jong et al (2019). Jong, G. de, Vignetti, S. and Pancotti, C. “Ex-post evaluation of major infrastructure projects Ex-post evaluation of major infrastructure projects”. Transportation Research Procedia. 46th European Transport Conference 2018 42, pp. 75–84. https:
//www.sciencedirect.com/science/article/pii/S2352146519305757.
Kehoe, J. (2020). “Why the RBA boss wants the stimulus to shift”. Australian Financial Review. https://www.afr.com/policy/economy/rba-boss- urges-stimulus-shift-20200813-p55lbi.
Kembrey, M. (2015). “Second crossing ’under way’ after power go-ahead: Transport - Poles and wires bill passes”. Sydney Morning Herald, p. 2. https://www.smh.com.au/national/nsw/nsw-governments-electricity- privatisation-gets-second-harbour-rail-crossing-under-way- 20150604-ghggqj.html.
Knowles, D. (2020). “Mammoth $5.4 billion project drives hiring spree”.
Courier Mail. https://www.couriermail.com.au/business/mammoth-54- billion-project-drives-hiring-spree/news- story/0e4a5e1b1053e681436b3f80b7196c9c.
(2018). “Hundreds of millions more to plan rail loop, but not all on board”. The Age. https://www.theage.com.au/politics/victoria/hundreds-of-millions- more-to-plan-rail-loop-but-not-all-on-board-20181014-p509kz.html.
Legislative Council Public Accountability Committee (2019). Impact of the CBD and South East Light Rail Project. Report 2. https://www.parliament.nsw.gov.au/lcdocs/inquiries/2492/Final%20R eport%20-%20Impact%20of%20the%20CBD%20and%20South
%20East%20Light%20Rail%20Project.pdf.
Love et al (2015). Love, P., Smith, J., Simpson, I. and Regan, M. “Understanding the landscape of overruns in transport infrastructure projects”. Environmental and Planning B: Planning and Design 42,
pp. 490–509. http://epb.sagepub.com/content/42/3/490.abstract.
Love et al (2016). Love, P., Ahiaga-Dagbui, D. and Z, I. “Cost overruns in transportation infrastructure projects: Sowing the seeds for a probabilistic theory of causation”. Transportation Research Part A: Policy and Practice 92, pp. 184–194. http:
//www.sciencedirect.com/science/article/pii/S0965856415302871.
Lowe, P. (2020). Statement to the House of Representatives Standing Committee on Economics. Hearing on Reserve Bank of Australia annual report 2019. https://parlinfo.aph.gov.au/parlInfo/download/co mmittees/commrep/868db039-2384-4ce9-a502- 1354709677d2/toc_pdf/Standing%20Committee%20on%20Economi cs_2020_08_14_7974_Official.pdf;fileType=application%2Fpdf#sear ch=%22committees/commrep/868db039-2384-4ce9-a502- 1354709677d2/0000%22.
Lucas, C. and Carey, A. (2017). “North East Link options reveal new road could cost as much as $23 billion”. The Age. https:
//www.theage.com.au/national/victoria/north-east-link-options-reveal- new-road-could-cost-as-much-as-20-billion-20170807-gxqp6s.html.
Lucas, C. and Jacks, T. (2017). “North East Link route confirmed as government sets budget at $16.5 billion”. The Age. https://www.theage.com.au/national/victoria/route-chosen-for-new- melbourne-freeway-20171124-gzryck.html.
Ludlow, M. (2019). “Angry farmers vow to fight $10b inland rail project”.
Australian Financial Review. https://www.afr.com/politics/federal/angry-farmers-vow-to-fight-10b- inland-rail-project-20190426-p51hfh.
Marszalek, J. (2020). “Kate Jones promises to deliver $5.4 billion Cross River Rail project on budget”. Courier Mail. https://www.couriermail.com.au/news/queensland/kate-jones- promises-to-deliver-54-billion-cross-river-rail-project-on- budget/news-story/da8f1e7de8f7850f4cf620d348500b20.
McCutcheon, P. (2020). “Queensland Opposition lands blows in Parliament over Brisbane Cross River Rail cost blow-out”. ABC News. https://www.abc.net.au/news/2020-08-12/queensland-controversy- over-brisbane-cross-river-rail-plan/12545858.
McDonald, P. (2020). A projection of Australia’s future fertility rates. Analysis by Peter McDonald for the Centre for Population. https://population.gov.au/downloads/McDonaldFertilityProjections.pdf.
McGinn, C. (2019). “New trains, own line, for Melbourne loop”. Canberra Times. https://www.canberratimes.com.au/story/6507921/new-trains- own-line-for-melbourne-loop/.
Merrow, E. (2011). Industrial Megaprojects: Concepts, Strategies, and Practices for Success. Wiley.
Metro Tunnel (n.d.). Frequently Asked Questions. https://metrotunnel.vic.gov.au/about-the-project/faq.
Minnikin, S. (2020). Letter to Auditor-General. https://www.parliament.qld.gov
.au/Documents/TableOffice/TabledPapers/2020/5620T1143.pdf#:~: text=However%2C%20information%20received%20from%20various,f our%20years%20away%20from%20completion.
North East Link Project (2020). About. https://northeastlink.vic.gov.au/about/.
NSW Government (2010). Metropolitan Transport Plan: Connecting the City of Cities. NSW Government. https://web.archive.org/web/20110406101341/http:
//www.nsw.gov.au/metropolitantransportplan.
(2013). NSW Budget 2013-14: Infrastructure Statement. Budget Paper 4. https://www.treasury.nsw.gov.au/sites/default/files/pdf/2013- 2014_Budget_Papers_BP4_Infrastructure_Statement.pdf.
(2016). $12 billion in budget for metro rail revolution. https://www.nsw.gov.au/media-releases/12-billion-budget-for-metro- rail-revolution.
(2019). Sydney Metro to open in three weeks. https://www.nsw.gov.au/media-releases/sydney-metro-to-open-three- weeks.
O’Sullivan, M. (2016). “WestConnex: Extra tunnel, road widening makes
$16.8b motorway even bigger”. Sydney Morning Herald. https://www.smh.com.au/national/nsw/westconnex-extra-tunnel-road- widening-makes-168b-motorway-even-bigger-20160719- gq8mae.html.
(2020a). “‘I am sorry’: Minister concedes metro line will blow out by $3 billion”. Sydney Morning Herald. https://www.smh.com.au/national/nsw/i-am-sorry-minister-concedes- metro-line-will-blow-out-by-3-billion-20200220-p542n0.html.
(2020b). “$4.3 billion cost blowout in Sydney’s metro rail project”.
Sydney Morning Herald.
https://www.smh.com.au/national/nsw/4-3-billion-cost-blowout-in- sydney-s-metro-rail-project-20200203-p53x7n.html.
Pallas, T. (2008). North East Link to Complete Orbital Freeway Network. https://www.smh.com.au/cqstatic/gzsfpw/2008NELinkRelease.JPG.
Parkes-Hupton, H. (2019). “Sydney light rail class actions members swell past 200”. Daily Telegraph. https://www.dailytelegraph.com.au/newslocal/central-sydney/sydney- light-rail-class-actions-members-swell-past-200/news- story/dfbc6b922ffce0b39fa2c282e47b0ba8.
Parliament of NSW General Purpose Standing Committee Number 4 (2010).
Transcript of hearing on transport, Central Coast. http://www.aptnsw.org.au/documents/estimates.html.
Parliament of Victoria (2020). North East Link Bill 2020. https://www.parliament.vic.gov.au/publications/research- papers/send/36-research-papers/13949-north-east-link-bill-2020.
PC (2006). Potential benefits of the National Reform Agenda. Report to the Council of Australian Governments. Productivity Commission. https://www.pc.gov.au/research/completed/national-reform- agenda/nationalreformagenda.pdf.
(2014). Public infrastructure. Productivity Commission. http://www.pc.gov.au/inquiries/completed/infrastructure/report.
Potter, B. (2020). “Small ticket projects can get budget billions flowing”.
Australian Financial Review. https://www.afr.com/policy/economy/small-ticket-projects-can-get- budget-billions-flowing-20201006-p562fr.
Queensland Government (2017). Queensland Budget 2017-18: Capital Statement. Budget Paper 3. https://s3.treasury.qld.gov.au/files/bp3-2017-18.pdf.
(2019). Queensland Budget 2017-18: Capital Statement. Budget Paper 3. https://budget.qld.gov.au/files/BP3.pdf.
Queensland Government and Brisbane City Council (2005). Airport Link Detailed Feasibility Study: Initial advice statement. http://eisdocs.dsdi p.qld.gov.au/Airport%20Link/IAS/IAS%20Oct%202005.pdf.
Rabe, T. and O’Sullivan, M. (2020). “Caution urged in states costing big transport projects after blowouts”. Sydney Morning Herald. https://www.smh.com.au/national/nsw/caution-urged-in-states- costing-big-transport-projects-after-blowouts-20200220-p542ty.html.
Ramey, V. A. (2019). “Ten years after the Financial Crisis: what have we learned from the renaissance in fiscal research?” Journal of Economic Perspectives 33.2, pp. 89–114.
Rooney, K. (2020a). “Transurban announces West Gate Tunnel now expected to be finished by 2023”. Herald Sun. https://www.heraldsun.com.au/news/victoria/transurban-announces- west-gate-tunnel-now-expected-to-be-finished-by-2023/news- story/59f7c8cd6276ede2f68f702ef0183f98.
(2020b). “West Gate Tunnel lay-offs begin as builders blame financial strain”. Herald Sun.
https://www.heraldsun.com.au/news/victoria/west-gate-tunnel-layoffs- begin-as-builders-blame-financial-strain/news- story/0d73c99c08c1d4cba17bcd7aa404b8ec.
Seimiatycki, M. (2009). “Academics and auditors: Comparing perspectives on transport project cost overruns”. Journal of Planning Education and Research 29, pp. 142–156. DOI: 10.1177/0739456X09348798.
https://www.researchgate.net/publication/238430262_Academics_an d_Auditors_Comparing_Perspectives_on_Transportation_Project_Co st_Overruns.
SGS Economics & Planning (2015). Strategic Review of the WestConnex Proposal: Final Report.
https://www.cityofsydney.nsw.gov.au/-/media/corporate/files/2020-07- migrated/files_1/140511-final-report-150409.pdf?download=true.
Rostron, S. (2016a). “CPB Contractors win $384m Section C of Bruce
Highway Upgrade”. Felix Project News.
https://www.felix.net/project-news/cpb-contractors-win-384m-section- c-of-bruce-highway-upgrade-cooroy-to-curra.
(2016b). “CPB Contractors awarded $420m Gold Coast Light Rail
(2019). North East Link Project - Net community benefit review. https://s3.ap-southeast-2.amazonaws.com/hdp.au.prod.app.vic- engage.files/5815/6325/4909/28k._BBW_City_Council_-
Stage Two”. Felix Project News. https://www.felix.net/project- news/cpb-contractors-awarded-420m-gold-coast-light-rail-stage-two.
Sanda, D. (2017). “Electricity sell off benefits NSW projects”. Yahoo News. https://au.news.yahoo.com/electricity-sell-off-benefits-nsw-projects- 35475392.html?guccounter=1.
Saulwick, J. (2012). “Sydney transport shake-up: plan for single deck metro-style trains and second harbour crossing”. Sydney Morning Herald. https://www.smh.com.au/national/nsw/sydney-transport- shake-up-plan-for-single-deck-metro-style-trains-and-second- harbour-crossing-20120620-20ngm.html.
(2015). “Multimillion-dollar compensation brawl brews over WestConnex St Peters interchange”. Sydney Morning Herald. https://www.smh.com.au/national/nsw/multimilliondollar- compensation-brawl-brews-over-westconnex-st-peters-interchange- 20150903-gje9oi.html.
Smith, T. (2020). “Supplying a fiscal lifeline: Valerie Ramey discusses what economists have learned about stimulus since the 2008 financial crisis”. American Economic Association. https://www.aeaweb.org/research/valerie-ramey-fiscal-policy-after- financial-crisis.
Supreme Court of New South Wales (2020). Light Rail Nuisance Class Action. http://www.supremecourt.justice.nsw.gov.au/Pages/sco2_classaction/ Light-Rail-Nuisance-Class-Action.aspx.
Terrill, M. and Danks, L. (2016). Cost overruns in transport infrastructure.
Report No. 2016-13. Grattan Institute. https:
//grattan.edu.au/report/cost-overruns-in-transport-infrastructure/.
Terrill et al (2018). Terrill, M., Batrouney, H., Ha, J. and Hourani, D. Remarkably adaptive: Australian cities in a time of growth. Grattan Institute. https://grattan.edu.au/wp-content/uploads/2018/10/909- Remarkably-adaptive-Australian-cities-in-a-time-of-growth.pdf.
Terrill et al (2019). Terrill, M., Moran, G. and Ha, J. Why it’s time for congestion charging: better ways to manage busy urban roads. Report No.
2019-10. Grattan Institute.
https://grattan.edu.au/report/why-its-time-for-congestion-charging/.
Terzon, E. (2020). “EPA approves controversial West Gate Tunnel Project soil-dumping plan for Bacchus Marsh”. ABC News. https://www.abc.net.au/news/2020-09-01/epa-approves-pfas-soil- dumping-plan-bacchus-marsh/12618482.
Transport and Infrastructure Council (2015). Infrastructure benchmarking
Ulubasoglu, M. and Onder, Y. K. (2020). “Teleworkability in Australia: 41 per cent of full-time and 35 per cent of part-time jobs can be done from home”. The Conversation. https://theconversation.com/teleworkability-in-australia-41-of-full- time-and-35-of-part-time-jobs-can-be-done-from-home-140723.
VAGO (2018). Assessing Benefits from the Regional Rail Link Project.
Victorian Auditor General’s Office. https://www.audit.vic.gov.au/sites/default/files/2018-05/20180510- Regional-Rail-Link.pdf.
report. https://www.transportinfrastructurecouncil.gov.au/sites/default/
files/Infrastructure_Benchmarking_Report.pdf.
(2020). Communiqué of 13th meeting of the Transport and Infrastructure Council of the Council of Australian Governments. https://www.transportinfrastructurecouncil.gov.au/sites/default/files/d
ocuments/13th-transport-and-infrastructure-council-communique.pdf.
(2019a). Market-led Proposals. Victorian Auditor General’s Office. https://www.audit.vic.gov.au/report/market-led-proposals.
(2019b). Melbourne Metro Tunnel Project - Phase 1: Early Works. Victorian Auditor General’s Office. https://www.audit.vic.gov.au/sites/default/files/2019-06/060619-Metro- Tunnel_1.pdf.
Transport Canberra (2019). City to Gungahlin Light Rail Project Delivery Report. Transport Canberra. https://www.transport.act.gov.au/about-us/public-transport- options/light-rail/light-rail-network/light-rail-project-delivery-report.
Transport for NSW (2012). Fixing the trains: Sydney’s rail future. https://www.transport.nsw.gov.au/newsroom-and-events/media- releases/fixing-trains-sydneys-rail-future.
(2020). Sydney Pinch Point Programs: Overview. https://www.rms.nsw.gov.au/projects/01documents/easing-sydneys- congestion/pinch-point-fact-sheet-2020-05.pdf.
Victorian Department of Economic Development, Jobs, Transport and Resources (2016). Melbourne Metro Business Case. https://metrotunnel.vic.gov.au/ data/assets/pdf_file/0006/40677/MM- Business-Case-Feb-2016-WEB.pdf.
Victorian Department of Treasury and Finance (2019). Metro Tunnel Project. https://www.dtf.vic.gov.au/partnerships-victoria-ppp-projects/metro- tunnel-project.
Victorian Government (2008). The Victorian Transport Plan. https://web.archive.org/web/20120325004350/https:
//transport.vic.gov.au/ data/assets/pdf_file/0013/31342/vtp.pdf.
Transurban (n.d.). M4-M5 Link Tunnels.
https://www.westconnex.com.au/roads-projects/m4-m5-link-tunnels/.
Treasurer of Victoria and Transurban (2017). West Gate Tunnel Project
Agreement. https://www.dtf.vic.gov.au/sites/default/files/2018-
01/West-Gate-Tunnel-Project-Agreement.pdf.
Trembath, M. (2012). “Greenlight for WestConnex tollway”. St.George and Sutherland Shire Leader. 3 October.
(2015). Western Distributor Business Case. https://transport.vic.gov.au/-/media/tfv-documents/western- distributor/western-distributor-business-case-redacted.pdf.
(2017). West Gate Tunnel Project Summary. https://www.dtf.vic.gov.au/sites/default/files/2018-01/West-Gate- Tunnel-Project-Summary.pdf.
Victorian Government (2018a). North East Link Business Case.
https://northeastlink.vic.gov.au/planning/businesscase.
(2018b). Suburban Rail Loop Strategic Assessment. https:
//bigbuild.vic.gov.au/ data/assets/pdf_file/0006/325572/Suburban-
(2020b). “Construction ‘on brink of collapse’, says John Holland CEO”. Australian Financial Review. https://www.afr.com/companies/infrastructure/construction-on-brink- of-collapse-says-john-holland-ceo-20200317-p54b2b.
Rail-Loop-Strategic-Assessment.pdf.
(2019). Victorian Budget 2019-20: Budget Paper 4. https://www.budget.vic.gov.au/budget-papers.
WA Government (2001). WA Budget 2001-02: Budget Statements. Budget Paper 2. https://www.ourstatebudget.wa.gov.au/2001-02/budget- papers/bp2/paper2.pdf.
(2002). WA Budget 2002-03: Budget Statements. Budget Paper 2. https://www.ourstatebudget.wa.gov.au/2002-03/budget- papers/bp2/bp2.pdf.
West, A. (2010). “All roads lead to the city: North-west rail delay, Metros dumped, Light rail for inner west”. Sydney Morning Herald. 22 February.
WestConnex (2013). WestConnex Business Case Executive Summary. https://www.westconnex.com.au/media/ixebloea/westconnex- business-case-executive-summary-september-2013.pdf.
(2015). WestConnex Updated Strategic Business Case. http:
//infrastructurepipeline.org/wp-content/uploads/2016/10/WestConnex- Updated-Strategic-Business-Case-November-2015-1.pdf.
Wiggins, J. (2017). “Inland rail costs could blow out to $16b, says National Trunk Rail”. Australian Financial Review. https://www.afr.com/companies/inland-rail-costs-could-blow-out-to- 16b-says-national-trunk-rail-20170511-gw2k2i#:~: text=The%20federal%20government%20this%20week,seven%20yea rs%20from%202017%2D18..
(2020a). “West Gate Tunnel dispute veers towards ‘full-flung fight’”.
Australian Financial Review. https://www.afr.com/companies/infrastructure/west-gate-tunnel- dispute-veers-towards-full-flung-fight-20200617-p553g3.
Willingham, R. (2019). “Metro Tunnel machines grind to halt in dispute over billions in cost blowouts”. ABC News. https://www.abc.net.au/news/2019-12-09/melbourne-metro-tunnel- project-grinds-to-halt-amid-dispute/11779986.
Wright, S. and Crowe, D. (2020). “A ‘short-term window’ to build infrastructure for long-term gain”. The Age. https://www.theage.com.au/politics/federal/a-short-term-window-to- build-infrastructure-for-long-term-gain-20200906-p55sc5.html.