Single parent families – not always who you think
In Australia, at the 2016 Census, there were 959,000 single-parent families with children recorded.
A total of 10.4% of all households had a single parent family as the only, or primary family in the household. This was down slightly from 10.6% in 2011, due to an increase in other categories. Nevertheless the total number of single-parent families increased by more than 50,000 over 5 years.
Disadvantage
Socio-economically, single-parent families are among the most disadvantaged population groups in Australia. The median income for single-parent families in 2016 was $974 per week, compared to $1,734 for all households – so around half.
The image people may have of a single parent family is that of a young mother who is struggling to balance looking after children with a low paid job, living in public housing, or even homeless. And there’s no doubt that there are certainly many single-parent families who meet that criteria. 82% of all single parents are female, a figure which varies very little from place to place.
But single-parent families come in all shapes and sizes. One thing the Census data does tell us is that single parents with “young” children – where all the children are under 15 – actually declined by 3,700 households between 2011 and 2016.
Single-parent families with older children
The entire growth of single-parents in Australia plus a bit more was made up of single parents with *older* children (that is, all the kids were over 15). And these now make up more than half of all single-parent family households, at just under half a million.
Of the 484,000 single-parent families with only older children, 142,000, or 29% still had dependent students aged 15-24 living at home. The remaining majority, 71%, had no dependent students or children under 15. Only children over 25.
So this amounts to 342,000 households, or about 36% of all single-parent families, which didn’t really have “children” living at home at all. They comprised an adult living with an older adult, and the category increase by 41,000 since 2011, or over 80% of the total single parent family increase.
What we’re really seeing here isn’t an increase in single-parent families at all – but an adult living with their parent – quite often caring for that parent in the latter stages of life. And because women live longer than men (an extra 5 years on average), this elderly parent is more likely to be female, contributing to the 82% female lone parent figure overall.
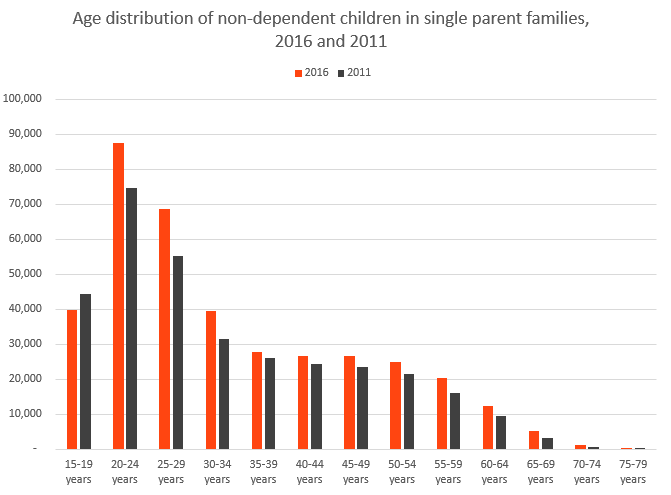
This is the age distribution of the 381,000 “children” over the age of 25 living with a single parent in Australia.

Now probably those in their 20s, of which there are quite a few – and a large increase – are those staying at home with Mum or Dad (not both, these are single-parent families) for longer than is traditional, perhaps due to affordability issues (I’ve already done a blog on this – Are children staying at home for longer?).
Remember to be a non-dependent child you need to either be over 25, or 15-24 and not a student, so university students aren’t included here.
These younger groups show a large increase. But proportionally larger increases are seen for “children” aged in their 50s and 60s. One particularly telling figure is the almost doubling of “children” aged 65-69 living with a (presumably) quite an elderly parent! These are the increasing number of baby boomers who are family carers.
The Census also measures caring responsibilities for an elderly or disabled person directly. Nationally, 11.3% of the population cared for an elderly or disabled person in their day to day life, up from 10.9% 5 years ago, and representing a 250,000 person increase. Among the “children” in single-parent families who were over 15, 18.9% provided unpaid assistance, mostly in the older categories. For those aged over 40, as a total, it was 37.6% who provided unpaid assistance.
Clearly, as we are living longer, more and more people are providing assistance to elderly parents living in the same household.
The Census captures this information, but it is buried in areas you may not think to look. Not everyone would regard a 45-year-old caring for an 80-year-old parent as a “single parent family” but that’s where it’s recorded. The increases we see in these categories from 2011 to 2016 are the natural result of people living longer. While they remain a minority, the increased prevalence of this family type does raise interesting questions for local government services, particularly services to the aged population.
.id is a team of population experts who combine online tools and consulting services to help local governments and organisations decide where and when to locate their facilities and services, to meet the needs of changing populations. Access our local government area information tools here.


Hi Glenn, Is there any way you can go a little further and give a statistic on single-parent families with a child with a disability. This would be of great benefit to charities like myself who are raising funds to help children with disabilities. You can correct me if I am wrong, but I think the statistic is 70% of parents who have a child with disability end in divorce or separation.
As a single mum just looking to make sense of the Census, I really appreciate your insight. I’m 70 and a son in his 40s lives with me. So now I know there are about 30,000 other such households, how can I use this data?