8 Corrective services - annual report 2017 - Productivity Commission
CONTENTS
8.1 Profile of corrective services 8.2
8.2 Framework of performance indicators 8.7
8.3 Key performance indicator results 8.9
8.4 Definitions of key terms 8.22
8.5 References 8.25
|
Attachment tables |
|
Attachment tables are identified in references throughout this chapter by a ‘8A’ prefix (for example, table 8A.1) and are available from the website (www.pc.gov.au/rogs/2018). |
|
|
|
|
This chapter reports on the performance of corrective services, which include prison custody and a range of community corrections orders and programs for adult offenders (for example, parole and community work orders). Both public and privately operated correctional facilities are included; however, the scope of this chapter generally does not extend to:
· youth justice (reported on in chapter 17, Youth justice services)
· prisoners or alleged offenders held in forensic mental health facilities to receive psychiatric care (who are usually the responsibility of health departments)
· prisoners held in police custody (reported on in chapter 6, Police services)
· people held in facilities such as immigration detention centres.
Further information on the Report on Government Services including other reported service areas, the glossary and list of abbreviations is available at www.pc.gov.au/rogs/2018.
8.1 Profile of corrective services
Service overview
The operation of corrective services is significantly influenced by, and in turn influences, other components of the criminal justice system such as police services and courts. The management of prisoners and of offenders serving community corrections orders is the core business of all corrective services agencies. However, the legislative frameworks governing and impacting on corrective services, for example sentencing acts, vary widely. The scope of the responsibilities of these agencies also varies, for example, functions administered by corrective services in one jurisdiction may be administered by a different justice sector agency in another, such as the management of prisoners held in court cells.
Roles and responsibilities
Corrective services are the responsibility of State and Territory governments, which may deliver services directly, purchase them through contractual arrangements or operate a combination of both arrangements. All jurisdictions maintained government‑operated prison facilities during the reporting period while private prisons operated in five jurisdictions (NSW, Victoria, Queensland, WA and SA). No detention centres operated during the reporting period as periodic detention was abolished as a sentencing option in NSW in 2010 and in the ACT as of 1 July 2016. A very small number of detainees with uncompleted orders continued to be supervised during the reporting period under arrangements that did not involve being held in a periodic detention centre.
Community corrections is responsible for administering a range of non‑custodial sanctions and also manages prisoners who are released into the community and continue to be subject to corrective services supervision. These services vary in the extent and nature of supervision, the conditions of the order (such as a community work component or a requirement to attend an offender program) and the level of restriction placed on the offender’s freedom of movement in the community (for example, home detention).
No single objective or set of characteristics is common to all jurisdictions’ community corrections services, other than that they generally provide a non‑custodial sentencing alternative or a post‑custodial mechanism for reintegrating prisoners into the community under continued supervision. In some jurisdictions, community corrections responsibility includes managing offenders on supervised bail orders. Table 8A.21 shows the range of sanctions involving corrective services that operated in each jurisdiction during the reporting period.
Funding
Nationally in 2016-17, expenditure (net of revenues) on corrective services was $3.1 billion for prisons and $0.5 billion for community corrections[1] (table 8A.1). Expenditure plus depreciation (matching expenditure reporting by other justice sector agencies) was $4.1 billion – a real increase of 7.2 per cent from 2015-16 (table 8A.2). Changes in expenditure need to be considered in the context of the growth in corrective services populations over time.
Size and scope of sector
Prison custody
Corrective services operated 114 custodial facilities nationally at 30 June 2017, comprising 88 government‑operated prisons, 10 privately‑operated prisons, four transitional centres, and twelve 24‑hour court cell complexes (holding prisoners under the responsibility of corrective services in NSW) (table 8A.3).
On average, 40 059 people per day were held in Australian prisons during 2016‑17 (table 8A.4), of which 79.1 per cent were held in secure facilities. A daily average of 7375 prisoners (18.4 per cent of the prisoner population), were held in privately operated facilities during the year (table 8A.4). Nationally, females represented 8.1 per cent of the daily average prison population, and Aboriginal and Torres Strait Islander prisoners represented 27.6 per cent of the daily average population.
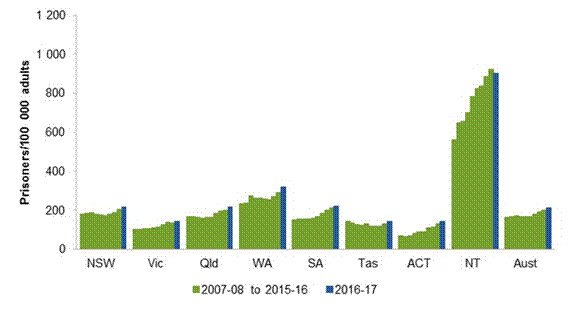
In 2016-17, the national imprisonment rate was 213.3 per 100 000 people in the relevant adult population (figure 8.1). This represents an increase of 30.2 per cent since 2007‑08 (table 8A.5). The rate for males (398.0 per 100 000 males) was almost 12 times the rate for females (34.2 per 100 000 females) (table 8A.5).
|
Figure 8.1 Imprisonment rates, total prisonersa |
|
|
|
a See table 8A.5 for detailed footnotes and caveats. |
|
Source: ABS
(unpublished) Australian Demographic Statistics, as at December
of each year, |
|
|
|
|
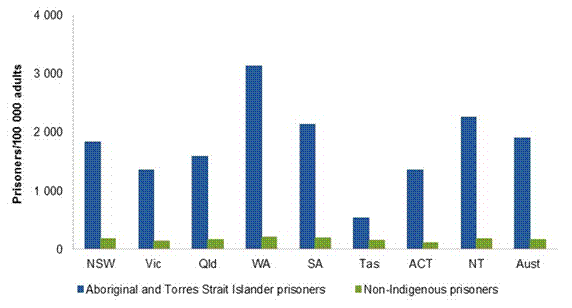
The national crude imprisonment rate per 100 000 Aboriginal and Torres Strait Islander population was 2411.5 in 2016‑17 compared with a rate of 156.6 for the non‑Indigenous population (table 8A.5). Comparisons of imprisonment rates should be made with care, especially for states and territories with relatively small Aboriginal and Torres Strait Islander populations. Small changes in prisoner numbers can cause variations in rates that do not accurately represent either real trends over time or consistent differences from other jurisdictions.
The Aboriginal and Torres Strait Islander population has a younger age profile compared with the non‑Indigenous population, which contributes to higher crude imprisonment rates. After adjusting for differences in population age structures, the national age standardised imprisonment rate per 100 000 Aboriginal and Torres Strait Islander population in 2016‑17 was 1903.6, compared with a corresponding rate of 165.5 for the non‑Indigenous population (figure 8.2). Therefore, after taking into account the effect of differences in the age profiles between the two populations, the national imprisonment rate for the Aboriginal and Torres Strait Islander population is almost 12 times greater than for the non‑Indigenous population. Rates that do not take age profile differences into account are 15 times greater.
|
Figure 8.2 Aboriginal and Torres Strait Islander and non‑Indigenous age standardised imprisonment rates, 2016‑17a |
|
|
|
|
a See table 8A.5 for detailed footnotes and caveats. |
|
|
Source: ABS (unpublished) Australian Demographic Statistics, Cat. no. 3101.0; ABS (unpublished) Experimental Estimates and Projections, Indigenous Australians (series B), Cat. no. 3238.0; State and Territory governments (unpublished); table 8A.5. |
|
|
|
|
|
|
While imprisonment rates for the Aboriginal and Torres Strait Islander population, whether calculated on a crude or age standardised basis, are higher than those for the non‑Indigenous population, the majority of prisoners are non‑Indigenous. Ten-year trends in daily average numbers and rates for Aboriginal and Torres Strait Islander and non‑Indigenous prisoners are reported in table 8A.6.
Community corrections
Nationally, on a daily average, there were 16.7 offenders for every one (full-time equivalent) community corrections staff member in 2016-17 (table 8A.7).
Nationally, an average of 68 110 offenders per day were serving community corrections orders in 2016‑17 (table 8A.8), with females representing 19.1 per cent of the offender population (higher than the proportion in the prison population), and Aboriginal and Torres Strait Islander offenders representing 20.1 per cent of the offender population (lower than the proportion in the prison population).
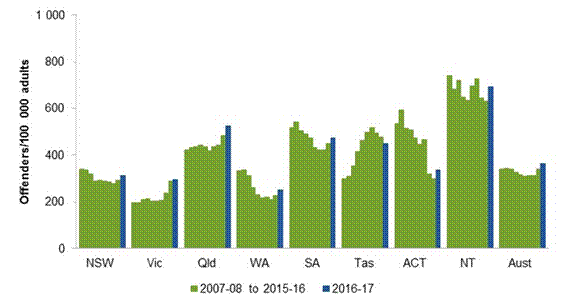
In 2016-17, the national crude community corrections rate was 362.7 per 100 000 relevant adult population. This is higher than the rate of 340.9 in 2007‑08 (figure 8.3). The rate for female offenders was 136.4 compared with 595.8 for male offenders (table 8A.5).
|
Figure 8.3 Community corrections rates, total offendersa |
|
|
|
|
a See table 8A.5 for detailed footnotes and caveats. Source: ABS (unpublished) Australian Demographic Statistics, as at December of each year, Cat. no. 3101.0; State and Territory governments (unpublished); table 8A.5. |
|
|
|
|
|
|
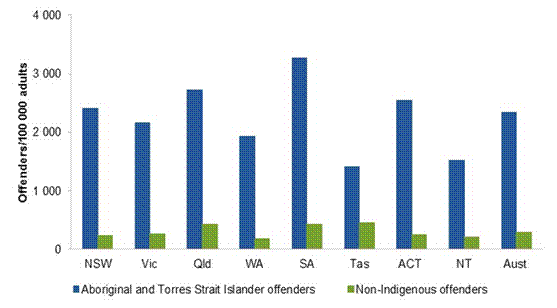
The national crude rate for the Aboriginal and Torres Strait Islander population was 2987.8 offenders per 100 000 relevant adult population, compared with 289.4 for the non‑Indigenous population (table 8A.5). After adjusting for differences in population age structures, the rate per 100 000 Aboriginal and Torres Strait Islander population in 2016‑17 was 2333.6, compared with a rate of 291.2 for the non‑Indigenous population (figure 8.4). Therefore, after taking into account the effect of differences in the age profiles between the two populations, the national Aboriginal and Torres Strait Islander community corrections rate is eight times greater than for the non-Indigenous population. Rates that do not take age profile differences into account are 10 times greater.
As with prisoners, comparisons should be made with care because small changes in offender numbers in jurisdictions with relatively small Aboriginal and Torres Strait Islander populations can cause variations in rates that do not accurately represent either real trends over time or consistent differences from other jurisdictions. Ten year trends are reported in table 8A.9.
|
Figure 8.4 Aboriginal and Torres Strait Islander and non‑Indigenous age standardised community corrections rates, 2016‑17a |
|
|
|
|
a See table 8A.5 for detailed footnotes and caveats. |
|
|
Source: ABS (unpublished) Australian Demographic Statistics, Cat. no. 3101.0; ABS (unpublished) Experimental Estimates and Projections, Indigenous Australians (series B), Cat. no. 3238.0; State and Territory governments (unpublished); table 8A.5. |
|
|
|
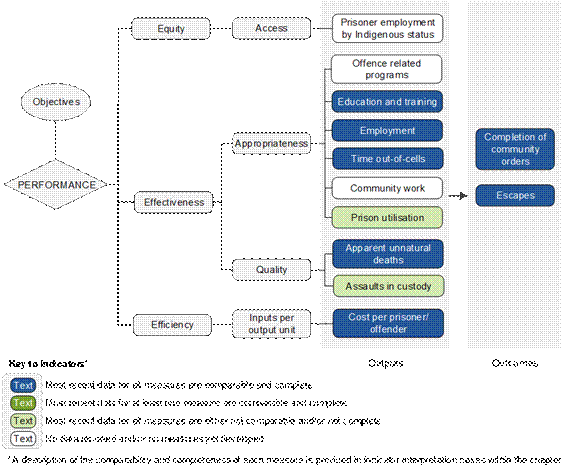
8.2 Framework of performance indicators
Corrective services performance is reported against objectives that are common to corrective services agencies in all jurisdictions (box 8.1).
|
Box 8.1 Objectives for corrective services |
|
Corrective services aim to contribute to the protection and creation of safer communities through the effective management of offenders and prisoners, commensurate with their needs and the risks they pose to the community, by providing: · a safe, secure and humane custodial environment · appropriate management of community corrections orders · programs and services that address the causes of offending, maximise the chances of successful reintegration into the community, and encourage offenders to adopt a law abiding way of life. Governments aim for corrective services to meet these objectives in an equitable and efficient manner. |
|
|
|
|
The performance indicator framework provides information on equity, efficiency and effectiveness, and distinguishes the outputs and outcomes of corrective services (figure 8.5). The framework shows which data are comparable in the 2018 Report. For data that are not considered directly comparable, the text includes relevant caveats and supporting commentary. Chapter 1 discusses data comparability, data completeness and information on data quality from a Report‑wide perspective. In addition to section 8.1, the Report’s statistical context chapter (chapter 2) contains data that may assist in interpreting the performance indicators presented in this chapter. Chapters 1 and 2 are available from the website at www.pc.gov.au/rogs/2018.
Improvements to performance reporting for corrective services are ongoing and will include identifying indicators to fill gaps in reporting against key objectives, improving the comparability and completeness of data and reviewing proxy indicators to see if more direct measures can be developed.
|
Figure 8.5 Corrective services performance indicator framework |
|
|
|
|
|
|
8.3 Key performance indicator results
Jurisdictional differences in service delivery settings, geographic dispersal and prisoner/offender population profiles have an impact on the effectiveness and efficiency of correctional service systems.
Outputs
Outputs are the services delivered (while outcomes are the impact of these services on the status of an individual or group) (see chapter 1). Output information is also critical for equitable, efficient and effective management of government services.
Equity
Access — Prisoner employment by Indigenous status
‘Prisoner employment by Indigenous status’ is an indicator of governments’ objective to provide programs and services in an equitable manner (box 8.2).
|
Box 8.2 Prisoner employment by Indigenous status |
|
‘Prisoner employment by Indigenous status’ measures the participation of eligible prisoners in employment opportunities that develop their work skills and qualifications and assist them to obtain employment after release from custody, disaggregated for Aboriginal and Torres Strait Islander and non-Indigenous prisoners. Similar levels of employment for Aboriginal and Torres Strait Islander and non-Indigenous prisoners indicates equity of access to prisoner employment. Data are not yet available for reporting against this indicator. |
|
|
|
|
Effectiveness
Appropriateness — Offence-related programs
‘Offence related programs’ is an indicator of governments’ objective to provide programs and services that address the causes of offending, maximise the chances of successful reintegration into the community, and encourage offenders to adopt a law abiding way of life (box 8.3).
|
Box 8.3 Offence related programs |
|
‘Offence related programs’ measures the delivery of programs to prisoners and offenders by corrective services that target specific factors related to their risk of re-offending. Data are not yet available for reporting against this indicator. |
|
|
|
|
Appropriateness — Education and training
‘Education and training’ is an indicator of governments’ objective of providing programs and services that address the causes of offending, maximise the chances of successful reintegration into the community, and encourage offenders to adopt a law abiding way of life (box 8.4).
|
Box 8.4 Education and training |
|
‘Education and training’ is defined as the number of prisoners participating in one or more accredited education and training courses under the Australian Qualifications Framework, as a percentage of those eligible to participate (that is, excluding those unable to participate for reasons of ill health, relatively short period of imprisonment or other reason). These data do not include participation in non‑accredited education and training programs or a range of offence related programs that are provided in prisons, such as drug and alcohol programs, psychological programs, psychological counselling and personal development courses. High or increasing education and training participation rates of prisoners are desirable. The rates reported for this indicator should be interpreted with caution as the indicator does not assess participation relative to individual prisoner needs, or measure successful program completion. Data reported for this measure are: · comparable (subject to caveats) across jurisdictions and over time · complete for the current reporting period (subject to caveats). All required 2016‑17 data are available for all jurisdictions. |
|
|
|
|
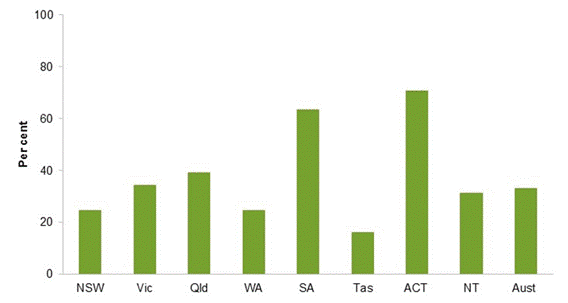
Nationally in 2016‑17, 32.9 per cent of eligible prisoners participated in accredited education and training courses (figure 8.6). Vocational education and training courses had the highest participation levels (22.4 per cent), followed by pre‑certificate Level 1 courses (8.4 per cent), secondary school education (3.1 per cent) and higher education (1.7 per cent) (table 8A.10).
|
Figure 8.6 Percentage of eligible prisoners in education and training, 2016‑17a |
|
|
|
|
a See box 8.4 and table 8A.10 for detailed definitions, footnotes and caveats. Source: State and Territory governments (unpublished); table 8A.10. |
|
|
|
|
|
|
Appropriateness — Employment
‘Employment’ is an indicator of governments’ objective of providing programs and services that address the causes of offending, maximise the chances of successful reintegration into the community, and encourage offenders to adopt a law abiding way of life (box 8.5).
|
Box 8.5 Employment |
|
‘Employment’ is defined as the number of prisoners employed as a percentage of those eligible to work (that is, excluding those unable to participate in work programs because of full‑time education and/or training, ill health, age, relatively short period of imprisonment or other reason). High or increasing percentages of prisoners in employment are desirable, as addressing the limited vocational skills and poor employment history of some prisoners has been identified as a key contributor to decreasing the risk of re‑offending. This indicator should be interpreted with caution because of factors outside the control of corrective services, such as local economic conditions, which affect the capacity to attract commercially viable prison industries, particularly where prisons are remote from large population centres. |
|
(continued next page) |
|
|
|
|
|
Box 8.5 (continued) |
|
Data reported for this measure are: · comparable (subject to caveats) across jurisdictions and over time · complete for the current reporting period (subject to caveats). All required 2016‑17 data are available for all jurisdictions. |
|
|
|
|
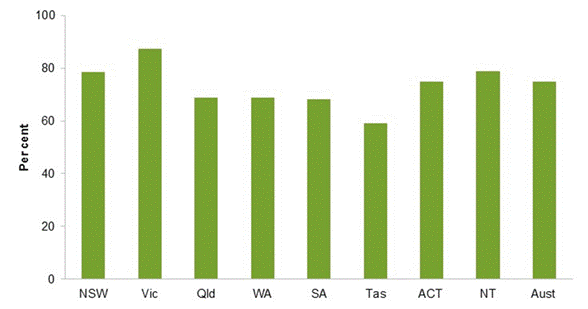
Nationally in 2016‑17, 74.7 per cent of the eligible prisoner population was employed (figure 8.7). Most prisoners were employed in service industries (43.9 per cent) or in commercial industries (30.2 per cent), with only a small percentage (0.7 per cent) on work release (table 8A.11).
|
Figure 8.7 Percentage of eligible prisoners employed, 2016‑17a |
|
|
|
|
a See box 8.5 and table 8A.11 for detailed definitions, footnotes and caveats. Source: State and Territory governments (unpublished); table 8A.11. |
|
|
|
|
|
|
Appropriateness — Time out‑of‑cells
‘Time out‑of‑cells’ is an indicator of governments’ objective of providing a safe, secure and humane custodial environment (box 8.6).
|
Box 8.6 Time out‑of‑cells |
|
‘Time out‑of‑cells’ is defined as the average number of hours in a 24‑hour period that prisoners are not confined to their cells or units. The periods during which prisoners are not confined to their cells or units provides them with the opportunity to participate in a range of activities that may include work, education and training, wellbeing, recreation and treatment programs, the opportunity to receive visits, and interacting with other prisoners and staff. A relatively high or increasing average time out‑of‑cells per day is desirable. Prison systems with higher proportions of prisoners who need to be accommodated in more secure facilities because of the potentially greater risk that they pose to the community are more likely to report relatively lower time out‑of‑cells. Data reported for this measure are: · comparable (subject to caveats) across jurisdictions and over time · complete for the current reporting period (subject to caveats). All required 2016‑17 data are available for all jurisdictions. |
|
|
|
|
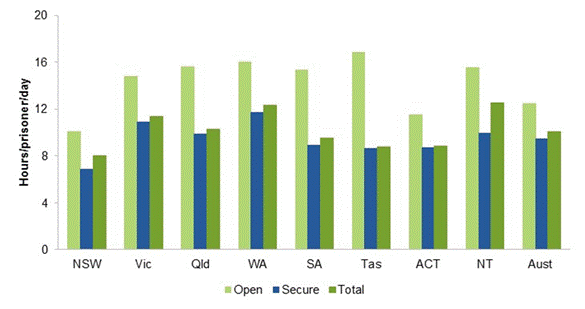
Nationally in 2016‑17, the average number of hours of time out‑of‑cells per prisoner per day was 10.1 (figure 8.8). Average time out‑of‑cells was higher for prisoners in open custody (12.4 hours) than for those held in secure custody (9.5 hours).
|
Figure 8.8 Time out‑of‑cells (average hours per day), 2016‑17a |
|
|
|
|
a See box 8.6 and table 8A.12 for detailed definitions, footnotes and caveats. Source: State and Territory governments (unpublished); table 8A.12. |
|
|
|
|
|
|
Appropriateness — Community work
‘Community work’ is an indicator of governments’ objective to provide appropriate management of community corrections orders (box 8.7).
|
Box 8.7 Community work |
|
‘Community work’ measures corrective services management of the requirements for offenders to perform unpaid community work. This indicator was reported against in previous years but, as part of work to improve proxy measures, is undergoing conceptual redevelopment and definition. Data are not yet available for reporting against this indicator. |
|
|
|
|
Appropriateness — Prison utilisation
‘Prison utilisation’ is an indicator of governments’ objective of providing a safe, secure and humane custodial environment (box 8.8).
|
Box 8.8 Prison utilisation |
|
‘Prison utilisation’ reflects the extent to which prison design capacity meets demand for prison accommodation. It is defined as the annual daily average prisoner population as a percentage of the number of single occupancy cells and designated beds in shared occupancy cells provided for in the design capacity of the prisons. It is generally accepted that prisons require spare capacity to cater for the transfer of prisoners, special‑purpose accommodation such as protection units, separate facilities for males and females and different security levels, and to manage short‑term fluctuations in prisoner numbers. Therefore percentages close to but not exceeding 100 per cent are desirable. Data reported for this measure are: · comparable (subject to caveats) across jurisdictions and over time · not complete for the current reporting period. Data for 2016‑17 were not provided by Victoria or SA. |
|
|
|
|
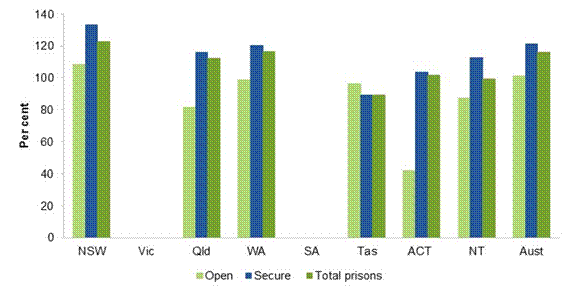
Nationally in 2016-17, prison utilisation was 115.8 per cent of prison design capacity. Prison utilisation was 101.3 per cent in open prisons and 121.2 per cent for secure facilities (figure 8.9).
|
Figure 8.9 Prison design capacity utilisation, 2016‑17a, b |
|
|
|
|
a Data are not provided by Victoria and SA. b See box 8.8 and table 8A.13 for detailed definitions, footnotes and caveats. |
|
|
Source: State and Territory governments (unpublished); table 8A.13. |
|
|
|
|
|
|
Quality — Apparent unnatural deaths
‘Apparent unnatural deaths’ is an indicator of governments’ objective of providing a safe, secure and humane custodial environment (box 8.9).
|
Box 8.9 Apparent unnatural deaths |
|
‘Apparent unnatural deaths’ is defined as the number of deaths, divided by the annual average prisoner population, multiplied by 100 (to give the rate per 100 prisoners), where the likely cause of death is suicide, drug overdose, accidental injury or homicide. Zero, low or decreasing rates of apparent unnatural deaths are desirable. The rates for this indicator should be interpreted with caution. A single incident in a jurisdiction with a relatively small prisoner population can significantly increase the rate in that jurisdiction, but would have only a minor impact in jurisdictions with larger populations. A relatively high rate in a jurisdiction with a small prisoner population can represent only a very small number of deaths. Data reported for this measure are: · comparable (subject to caveats) across jurisdictions and over time · complete for the current reporting period (subject to caveats). All required 2016‑17 data are available for all jurisdictions. |
|
|
|
|
Nationally in 2016-17, the overall rate of deaths of prisoners from apparent unnatural causes was 0.05 per 100 prisoners (table 8A.14). The rate for Aboriginal and Torres Strait Islander prisoners and non‑Indigenous prisoners was the same (table 8.1).
|
Table 8.1 Rate and number of prisoner deaths from apparent unnatural causes, by Indigenous status, 2016‑17a |
||||||||||||||||||||||||||||||||||||||||||||||||||||||||||||||||||||||
|
||||||||||||||||||||||||||||||||||||||||||||||||||||||||||||||||||||||
|
a See box 8.9 and tables 8A.14 and 8A.15 for detailed definitions, footnotes and caveats. – Nil or rounded to zero. |
||||||||||||||||||||||||||||||||||||||||||||||||||||||||||||||||||||||
|
Source: State and Territory governments (unpublished); table 8A.15. |
||||||||||||||||||||||||||||||||||||||||||||||||||||||||||||||||||||||
|
|
||||||||||||||||||||||||||||||||||||||||||||||||||||||||||||||||||||||
|
|
Quality — Assaults in custody
‘Assaults in custody’ is an indicator of governments’ objective of providing a safe, secure and humane custodial environment (box 8.10).
|
Box 8.10 Assaults in custody |
|
‘Assaults in custody’ is defined as the number of victims of acts of physical violence committed by a prisoner that resulted in physical injuries reported over the year, divided by the annual daily average prisoner population, multiplied by 100 (to give the rate per 100 prisoners). Rates are reported for two measures: · assaults against another prisoner by seriousness of impact · assaults against a member of staff by seriousness of impact. ‘Assaults’ refer to acts of physical violence resulting in a physical injury but not requiring overnight hospitalisation or on‑going medical treatment. ‘Serious assaults’ refer to acts of physical violence resulting in injuries that require treatment involving overnight hospitalisation in a medical facility or ongoing medical treatment, as well as all sexual assaults. Zero, low or decreasing rates of assaults in custody are desirable. The rates reported for this indicator should be interpreted with caution. A single incident in a jurisdiction with a relatively small prisoner population can significantly increase the rate in that jurisdiction, but would have only a minor impact in jurisdictions with larger prisoner populations. A relatively high rate in a jurisdiction with a small prisoner population may represent only a very small number of actual incidents. |
|
(continued next page) |
|
|
|
|
|
Box 8.10 (continued) |
|
Data reported for this measure are: · comparable over time but not directly comparable across jurisdictions due to different reporting practices and variation in service delivery arrangements for delivering prisoner health care, whereby not all jurisdictions have access to the medical information needed to accurately classify incidents into the assault categories used in this indicator · complete for the current reporting period (subject to caveats). All required 2016‑17 data are available for all jurisdictions. |
|
|
|
|
Table 8.2 presents data on assault rates in 2016‑17. Australian averages have not been calculated as this indicator is not comparable across jurisdictions.
|
Table 8.2 Rate of prisoner assaults, 2016‑17a |
||||||||||||||||||||||||||||||||||||||||||||||||||||||||||||||||||||||||||||||||
|
||||||||||||||||||||||||||||||||||||||||||||||||||||||||||||||||||||||||||||||||
|
a See box 8.10 and table 8A.16 for detailed definitions, footnotes and caveats. – Nil or rounded to zero. |
||||||||||||||||||||||||||||||||||||||||||||||||||||||||||||||||||||||||||||||||
|
Source: State and Territory governments (unpublished); table 8A.16. |
||||||||||||||||||||||||||||||||||||||||||||||||||||||||||||||||||||||||||||||||
|
|
||||||||||||||||||||||||||||||||||||||||||||||||||||||||||||||||||||||||||||||||
|
|
||||||||||||||||||||||||||||||||||||||||||||||||||||||||||||||||||||||||||||||||
Efficiency
Cost per prisoner/offender
‘Cost per prisoner/offender’ is an indicator of governments’ objective to provide corrective services in an efficient manner (box 8.11).
|
Box 8.11 Cost per prisoner/offender |
|
‘Cost per prisoner/offender’ is defined as the average daily cost of providing corrective services per prisoner and per offender, reported separately for net operating expenditure and for capital costs per prisoner and offender and for secure and open custody for prisoners. A low or decreasing cost is desirable in achieving efficient resource management. Efficiency indicators are difficult to interpret in isolation and should be considered in conjunction with effectiveness indicators. A low cost per prisoner, for example, can reflect less emphasis on providing prisoner programs to address the risk of re‑offending. |
|
(continued next page) |
|
|
|
|
|
Box 8.11 (continued) |
|
Factors that can affect the results for this indicator include: the composition of the prisoner population requiring different accommodation and/or management; the size and dispersion of the geographic area across which services are delivered; the potential (or lack of) for economies of scale; and, the impact of the wider criminal justice system policies and practices. Data reported for this measure are: · comparable (subject to caveats) across jurisdictions and over time · complete for the current reporting period (subject to caveats). All required 2016‑17 data are available for all jurisdictions. |
|
|
|
|
Nationally in 2016‑17, recurrent expenditure per prisoner per day, comprising net operating expenditure and capital costs[2], was $286 (figure 8.10).
|
Figure 8.10 Recurrent expenditure per prisoner per day, 2016‑17a |
|
|
|
|
a See box 8.11 and table 8A.17 for detailed definitions, footnotes and caveats. |
|
|
Source: State and Territory governments (unpublished); table 8A.17. |
|
|
|
|
|
|

Excluding capital costs, the real net operating expenditure was $215 per prisoner per day in 2016-17 compared with $225 in 2012‑13 (figure 8.11), and $22 per offender per day compared with $25 in 2012‑13 (figure 8.12).
|
Figure 8.11 Real net operating expenditure
per prisoner per day |
|
|
|
|
a See box 8.11 and table 8A.18 for detailed definitions, footnotes and caveats. |
|
|
Source: State and Territory governments (unpublished); table 8A.18. |
|
|
|
|
|
|

|
Figure 8.12 Real net operating expenditure
per offender per day |
|
|
|
|
a See box 8.11 and table 8A.18 for detailed definitions, footnotes and caveats. |
|
|
Source: State and Territory governments (unpublished); table 8A.18. |
|
|
|
|
|
|

Outcomes
Outcomes are the impact of services on
the status of an individual or group (while outputs are the actual services
delivered) (see chapter 1).
Completion of community orders
‘Completion of community orders’ is an indicator of governments’ objective to contribute to the protection and creation of safer communities through the effective management of offenders (box 8.12).
|
Box 8.12 Completion of community orders |
|
‘Completion of community orders’ is defined as the percentage of community corrections orders completed during the year that were not breached for failure to meet the order requirements or because further offences were committed. Order requirements may involve restrictions on the offender’s liberty (as with home detention), a requirement to undertake community work or other specified activity (such as a drug or alcohol program), regularly attending a community corrections centre as part of supervision requirements, or other conditions. High or increasing percentages of order completions are desirable. Completion rates should be interpreted with caution. The indicator is affected by differences in the overall risk profiles of offender populations, and risk assessment and breach procedure policies. High‑risk offenders subject to higher levels of supervision have a greater likelihood of being detected when conditions of orders are breached. High breach rates could therefore be interpreted as a positive outcome reflecting the effectiveness of more intensive offender management. Alternatively, a high completion rate can mean either high compliance or a failure to detect or act on breaches of compliance. Data reported for this measure are: · comparable (subject to caveats) across jurisdictions and over time · complete for the current reporting period (subject to caveats). All required 2016‑17 data are available for all jurisdictions. |
|
|
|
|
Nationally in 2016‑17, 72.2 per cent of community corrections orders were completed. Completion rates were higher for females than males (73.4 and 71.9 per cent respectively) and higher for non-Indigenous than Aboriginal and Torres Strait Islander offenders (74.7 and 63.2 per cent respectively). Completions by order type were highest for restricted movement orders (80.2 per cent), followed by reparation orders (76.4 per cent) and supervision orders (70.0 per cent) (figure 8.13).
|
Figure 8.13 Completion of community corrections orders, by type of order, 2016‑17a, b |
|
|
|
|
a Data for restricted movement orders are not applicable to Victoria, Queensland, Tasmania and the ACT, as these jurisdictions did not have this category of order during the reporting period. b See box 8.12 and table 8A.19 for detailed definitions, footnotes and caveats. |
|
|
Source: State and Territory governments (unpublished); table 8A.19. |
|
|
|
|
|
|

Escapes
‘Escapes’ is an indicator of governments’ objective to contribute to the protection and creation of safer communities through the effective management of prisoners (box 8.13).
|
Box 8.13 Escapes |
|
‘Escapes’ is defined as the number of
escapes divided by the annual average Zero, low or decreasing rates are desirable. Escape rates should be interpreted with caution. A single incident in a jurisdiction with a relatively small prisoner population can significantly increase the rate in that jurisdiction, but would have only a minor impact in jurisdictions with larger populations. A relatively high rate in a jurisdiction with a small prisoner population can represent only a very small number of actual incidents. Data reported for this measure are: · comparable (subject to caveats) across jurisdictions and over time · complete for the current reporting period (subject to caveats). All required 2016‑17 data are available for all jurisdictions. |
|
|
|
|
Nationally in 2016-17, the rate of escapes was 0.38 per 100 prisoners held in open custody and 0.03 per 100 prisoners held in secure custody (table 8.3).
|
Table 8.3 Rate and number of prisoner escapes, 2016‑17a |
||||||||||||||||||||||||||||||||||||||||||||||||||||||||||||||||||||||||||||||||||||||||
|
||||||||||||||||||||||||||||||||||||||||||||||||||||||||||||||||||||||||||||||||||||||||
|
a See box 8.13 and table 8A.20. – Nil or rounded to zero. |
||||||||||||||||||||||||||||||||||||||||||||||||||||||||||||||||||||||||||||||||||||||||
|
Source: State and Territory governments (unpublished); table 8A.20. |
||||||||||||||||||||||||||||||||||||||||||||||||||||||||||||||||||||||||||||||||||||||||
|
|
||||||||||||||||||||||||||||||||||||||||||||||||||||||||||||||||||||||||||||||||||||||||
|
|
||||||||||||||||||||||||||||||||||||||||||||||||||||||||||||||||||||||||||||||||||||||||
8.4 Definitions of key terms
|
24‑hour |
Cells located in a court and/or police complex that are administered by corrective services. |
|
Aboriginal and Torres Strait Islander |
People identifying themselves as an Aboriginal and/or Torres Strait Islanders if they are accepted as such by an Aboriginal or Torres Strait Islander community. |
|
Assault |
An act of physical violence committed by a prisoner that resulted in physical injuries. An assault is recorded where either: · a charge is proved either by a jurisdictional correctional authority, a Governor’s hearing or a court of law, or · there is evidence that an assault took place because at least one of the following circumstances apply: - there is at least one apparently reliable witness to the assault, or the victim claims assault and there is no obvious reason to doubt this claim, or - a visible injury has occurred and there is sufficient circumstantial or other evidence to make an assault the most likely cause of the injury on the basis of the balance of probabilities. The rate is based on a count of victims of assaults not incidents, that is, an assault by two prisoners on one other prisoner is counted as one assault, whereas a single incident in which one prisoner assaults two other prisoners is counted as two assaults. |
|
Apparent unnatural death |
The death of a person who is in corrective services custody (which includes deaths that occur within prisons, during transfer to or from prison, within a medical facility following transfer from prison, or in the custody of corrective services outside a custodial facility): · whose death is caused or contributed to by traumatic injuries sustained, or by lack of proper care, while in such custody · who dies or is fatally injured in the process of prison officers attempting to detain that person · who dies or is fatally injured in the process of that person escaping or attempting to escape from prison custody · where there is sufficient evidence to suggest, subject to a Coroner’s finding, that the most likely cause of death is homicide, suicide, an accidental cause or a drug overdose. |
|
Capital costs |
Combined depreciation costs, the user cost of capital (calculated as 8 per cent of the value of government land and other assets), and debt servicing fees – financial lease payments incurred by governments as part of contracts for privately owned prisons or prisons built under Public‑Private Partnership arrangements, comparable to the user cost of capital for government owned facilities. |
|
Community |
Community‑based management of court‑ordered sanctions, post‑prison orders and administrative arrangements and fine conversions for offenders, which principally involve one or more of the following requirements: supervision; program participation; or community work. |
|
Community work (offenders) |
Unpaid community work (hours) by offenders serving community corrections orders during the counting period. |
|
Escapes |
The escape of a prisoner under the direct supervision of corrective services officers or private providers under contract to corrective services, including escapes during transfer between prisons, during transfer to or from a medical facility, escapes that occurred from direct supervision by corrective services outside a prison, for example during escort to a funeral or medical appointment. |
|
Health expenditure |
Expenditure on primary, secondary and tertiary health services for prisoners incurred either directly by corrective services or indirectly by other departments, agencies or service providers on behalf of Corrective Services. |
|
Home detention |
A corrective services program requiring offenders to be subject to supervision and monitoring by an authorised corrective services officer while confined to their place of residence or a place other than a prison. |
|
Imprisonment rate |
The annual average number of prisoners per 100 000 population aged 17 years or over in those jurisdictions where persons are remanded or sentenced to adult custody at 17 years of age, or 18 years or over in those jurisdictions where the age for adult custody is 18 years old. |
|
Net operating expenditure per prisoner/offender |
The daily cost of managing a prisoner/offender, based on operating expenditure net of operating revenues (see definitions below) divided by (i) the number of days spent in prison or detention by the daily average prisoner population and the daily average periodic detention population on a 2/7th basis or (ii) the number of days spent under community corrections supervision by the daily average community corrections population respectively. |
|
Offender |
An adult person subject to a non-custodial order administered by corrective services, which includes bail orders if those orders are subject to supervision by community corrections. |
|
Open prison |
A custodial facility where the regime for managing prisoners does not require them to be confined by a secure perimeter physical barrier, irrespective of whether a physical barrier exists. |
|
Operating expenditure |
Expenditure of an ongoing nature incurred by government in the delivery of corrective services, including salaries and expenses in the nature of salary, other operating expenses incurred directly by corrective services, grants and subsidies to external organisations for the delivery of services, and expenses for corporate support functions allocated to corrective services by a broader central department or by a ‘shared services agency’, but excluding payroll tax and excluding prisoner health and transport/escort costs where able to be disaggregated by jurisdictions. Net operating expenditure also excludes operating revenues. |
|
Operating revenues |
Revenue from ordinary activities undertaken by corrective services, such as prison industries. |
|
Prison |
A legally proclaimed prison or remand centre for adult prisoners. |
|
Prisoner |
A person held in full time custody under the jurisdiction of an adult corrective services agency. This includes sentenced prisoners serving a term of imprisonment and unsentenced prisoners held on remand. |
|
Private prison |
A government or privately owned prison (see prison) managed under contract by a private sector organisation. |
|
Recurrent expenditure |
The combined total of net operating expenditure (i.e. operating expenditure excluding operating revenues) and capital costs (see previous definitions). |
|
Reparation order |
A subcategory of community‑based corrections orders with a community service bond/order or fine option that requires them to undertake unpaid work. |
|
Restricted |
A subcategory of community‑based corrections orders that limits the person’s liberty to their place of residence unless authorised by corrective services to be absent for a specific purpose, for example, Home Detention Orders. |
|
Secure prison |
A custodial facility where the regime for managing prisoners requires them to be confined by a secure perimeter physical barrier. |
|
Supervision order |
A subcategory of community‑based corrections orders that includes a range of conditions other than those categorised as restricted movement or reparation. |
|
Transitional Centres |
Transitional Centres are residential facilities administered by corrective services where prisoners are prepared for release towards the end of their sentences. |
|
Transport and escort services |
Services used to transport prisoners between prisons or to/from external locations (for example, court), whether by corrective services officers or external contractors involved in escorting prisoners as part of the transport arrangements. |
|
User cost of capital |
The cost of funds which are tied up in government capital used to deliver services and identifies the opportunity cost of this capital (the return forgone by using the funds to deliver services rather than investing them elsewhere or using them to retire debt). User cost of capital is calculated by applying a nominal rate of 8 per cent to the value of government assets. |
8.5 References
ABS (Australian Bureau of Statistics)
—— Australian Demographic Statistics, Cat. no. 3101.0, Canberra (various years, unpublished)
—— Experimental Estimates and Projections, Indigenous Australians (series B), Cat. no. 3238.0, Canberra (various years, unpublished)
[1] This expenditure is net of operating revenues and excludes capital costs (depreciation, user cost of capital and debt service fees), payroll tax, expenditure on transport/escort services and prisoner health. Some jurisdictions are unable to fully disaggregate transport costs and/or health expenditure from other prison operating costs. See table 8A.1 for detailed definitions, footnotes and caveats.
[2] Capital costs are comprised of depreciation costs, the user cost of capital (8 per cent of the value of government assets), and debt service fees – financial lease payments incurred by governments as part of contracts for privately owned prisons or prisons built under Public‑Private Partnership arrangements, comparable to the user cost of capital for government owned facilities.