THE COST OF PRISONS IN AUSTRALIA: 2023 - IPA - JULY 2023

JULY 2023
THE COST OF PRISONS IN
AUSTRALIA: 2023
Mia Schlicht
Research Analyst
Mia Schlicht, Research Analyst
Contents
![]() The
costs of
the corrections
system
5
The
costs of
the corrections
system
5
![]() Incarceration
of low-risk,
non-violent
offenders
13
Incarceration
of low-risk,
non-violent
offenders
13
![]() Characteristics
of prisoners
in
2023
18
Characteristics
of prisoners
in
2023
18
Key findings
There is an emerging incarceration crisis in Australia
• In 1975, there were 8,900 people in Australian prisons. In 2022, there were over 40,500.
• 38 per cent of these prisoners have been incarcerated for low-risk non-violent offences.
• The incarceration rate is now 205 for every 100,000 of the adult population - this rate has more than doubled over the last four decades.
• Australia has the third fastest incarceration growth rate in comparison to all OECD countries.
• Australia has one of the highest reimprisonment rates internationally with 60 per cent of the prison population having been imprisoned before.
The level of government spending on prisons is wasteful and unsustainable
• Australia spends over $6 billion each year on the construction and operation of prisons – this has increased by $2 billion in just five years.
• The cost of incarceration to the taxpayer is $147,900 per prisoner per year, or $405 per day.
• As the number of sentenced prisoners continues to grow, so will government spending on prisons.
• Each year $2.3 billion is spent on imprisoning low-risk non-violent offenders.
• A one per cent shift in the number of non-violent offenders in prison would save the taxpayer more than $23 million per year nationwide.
• The ACT spends the most of all the states on ongoing costs such as staffing and maintenance despite having the lowest percentage of prison utilisation.
Sentencing is not responding to the change in crime in Australia
• The number of offenders in Australia has dropped over the past decade. Despite this the imprisonment rate continues to climb.
• Although the overall number of low-risk non-violent offenders has decreased, the proportion of those offenders being sentenced to prison has increased.
• More than a third of prisoners received a short prison sentence of less than 6 months.
• Short prison sentences are the most damaging for rehabilitation with high reoffending rates associated with frequent and shorter sentence lengths.
• The high reoffending rate coupled with short sentence lengths indicates that a large portion of the prison population are stuck in a cycle of imprisonment, release, and reoffending.
More resources are being spent on punishing non-violent offenders
• The total number of victims has steadily declined over the past decade.
• This decline coupled with the growth in incarcerations indicates that there is an increase in the number of offenders being imprisoned for victimless crimes.
• Taxpayer funds are therefore being spent on incarcerating offenders posing no threat to community safety.
To reduce unnecessary incarceration and keep the community safe, governments should:
• Extend the use of alternative punishments like electronic home monitoring and fines for non-violent, low-risk offenders.
• Off-set the Australian labour shortage by allowing low-risk non-violent offenders to substitute their imprisonment term for a community-based sanctions in the form of full-time employment.
• Not punish victimless crimes with incarceration.
• Introduce tax penalties for white collar crimes such as fraud.
• Allow offenders to make restitution to their victims and take this into account in sentencing.
• Broaden the applicability of fines and restitution by enabling alternative collection mechanisms, such as garnishing wages and reducing government benefits.
• Redirect resources saved from incarcerating fewer criminals to the police, strengthening their capacity to deter and detain criminals.
Introduction
The fundamental aims of the Australian criminal justice system include ensuring public safety, deterring criminal behaviour, holding offenders accountable and providing restitution for victims.
Incarceration plays a particular role in supporting these aims.
It is important that violent, antisocial, and dangerous criminals are removed from the community so that they cannot bring further harm onto others. This isolation of threats to the community is a useful and unique function of prisons. However, not all prisoners pose a community threat.
Australia’s imprisonment rate has increased sharply in the last four decades. In 1975, there were 8,900 people in prisons across Australia – there are now over 40,500. The number of prisoners has increased by 355 per cent despite the population of Australia increasing by just 86 per cent. This has resulted in an incarceration rate of 205 per 100,000 of the adult population which places Australia as one of the fastest growing incarcerators in the world amongst other OECD countries.
Of these 40,500 prisoners, 38 per cent have been imprisoned for non-violent offences. Alternative justice measures such as electronic monitoring, home detention, fines,
tax penalties, restitution orders and other such measures may be preferable. These alternatives would better realise the interests of those who suffer the most from crimes, the victims, who have vocalised their discontent with the tough-on-crime rhetoric in Australia that has led to an overreliance on incarceration as a form of justice.
Opting for alternatives to prison not only provides better restitution for victims of crime, but is also less financially burdensome on taxpayers. Spending on the Australian criminal justice system is the highest it has ever been with governments spending $21 billion in 2021-2022 alone. The construction and maintenance of prisons cost the Australian taxpayer over $6 billion in the last year - an increase in $2 billion over the past five years. This equates to $405 per prisoner per day, or $147,900 per year. It
is expected that this number will continue to increase as does the number of prisoners. Australian prisons are almost at 100 per cent capacity and new facilities will need to be built in order to house the growing number of prisoners.
In 2021-22, $2.3 billion was spent on incarcerating non-violent offenders. A one per cent shift in the number of non-violent offenders in prison would save the taxpayer more than $23 million per year.
The crime landscape across Australia has seen a change in recent years. Offender rates have declined along with the number of victims of crime. Despite this notable shift, sentencing reform has not responded. Of those fewer non-violent offenders, more are being imprisoned for short lengths of time which is contributing to Australia’s high reoffence rate. More than 60 per cent of Australia’s prison population has been
previously incarcerated which is one of the highest reoffending rates in the world. Over a third of convicted prisoners in 2021-22 received a prison sentence of less than six months. Short and frequent sentences are associated with high recidivism rates and 66 per cent of these short sentences are served by non-violent offenders.
Incarceration reform must respond to the changes in the nature and reasons for offending to address the root cause of crime and make communities safer. Due to this lack of reform, incarceration is increasingly being viewed as a cause of the problem of offending rather than a solution. Imprisonment is a destabilising process that is linked with unemployment, instability and worse lifetime economic outcomes. The
imprisonment of non-violent offenders can inadvertently turn them into serious criminals who are unable to reintegrate back into productive society.
Criminal behaviour must be punished. However, a distinction needs to be made between those we are afraid of and those we are mad at. For those who are low risk offenders, alternative justice measures should be imposed to punish behaviour whilst also incentivising criminals to make better decisions and foster their rehabilitation with the community.
This paper presents the case for reform to Australia’s incarceration policies by presenting the costs of the criminal justice system in Australia; investigating who is in the system and why; analysing the reasons behind the changing crime scene; and suggesting directions toward an improved system.
This paper finds that the policy surrounding incarceration has not changed for a long time despite obvious changes in the nature of offending and criminal behaviour. Prisons are being used for broader purposes than necessary. Of the aims of the criminal justice system – public safety, deterrence, retribution, and restitution – only public safety through incapacitation can uniquely be achieved by prison. Where public safety is not a concern, alternative methods should be introduced.
It is thus argued that prisons should be returned to their core and unique purpose of incapacitating violent offenders who pose a threat to public safety and antisocial repeat offenders who have failed to respond to alternative punishments.
The costs of the corrections system

Criminal justice constitutes a large and
growing part of Australian government budgets.
The
costs
of
criminal
justice
comprise
government
expenditures
on police,
courts
and
prisons,
and
indirect
costs
resulting
from
criminal
punishment. This
section details these costs and illustrates why it is appropriate to place
them under greater scrutiny.
Overall cost of the criminal justice system
In 2021-22 the state and commonwealth governments spent over $21 billion on the criminal justice system, comprising of police, criminal courts, and corrective services.1 Of this spending, 26 per cent was on corrective services.2 Corrective services have seen the greatest increase in real recurrent expenditure over the past decade with an increase of $2.5 billion in spending.3 Overall, total spending on the criminal justice system has increased by $6.5 billion in the last ten years.4 It is expected that these costs will continue to increase as the number of inmates continue to grow and facilities need to be expanded in order to hold them.
The cost of prisons
Australian governments spent about $6.1 billion on prisons in 2021-22.5 This equates to about $405 to incarcerate one prisoner for one day on average or about $147,900 per year.6 There are substantial cost differences across the jurisdictions—the Australian Capital Territory (ACT) has the highest operating costs at $681 per prisoner per day ($249,000 per year), approximately 125 per cent higher than the lowest cost state, South Australia (SA) which houses its prisoners for $303 per day ($111,000 per year).7
![]()
1 Productivity Commission, Report on Government Services (Report, 31 January 2023) Volume C Section 8 <https:// www.pc.gov.au/ongoing/report-on-government-services/2023/justice/corrective-services>.
2 Ibid.
3 Ibid.
4 Ibid.
5 Ibid, Table 8A.1.
6 Ibid, Table 8A.19.
7 Ibid.
Nationwide the cost of incarceration per prisoner has grown by 34 per cent from 2014-15 to 2021-22 in real terms, with a total growth of approximately $38,000 per prisoner over the previous seven years.8 All of the eight states and territories have seen an increase in the cost of incarceration per prisoner since 2015.
Chart 1: The cost of prisons
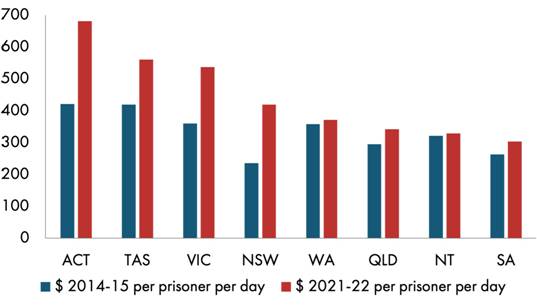
Source: Productivity Commission, Report on Government Services 2023
Table 1: Prison operating costs (2021-22)9
|
|
Net operating costs (per prisoner per day) |
Capital cost (per prisoner per day) |
Total cost (per prisoner per day) |
Annual cost (per prisoner per year) |
Growth in net operating costs since 2014-15 (%) |
|
NSW |
$287 |
$132 |
$419 |
$152,950 |
59% |
|
VIC |
$409 |
$129 |
$538 |
$196,200 |
38% |
|
QLD |
$241 |
$101 |
$342 |
$124,930 |
36% |
|
SA |
$225 |
$78 |
$303 |
$110,635 |
9% |
|
WA |
$297 |
$74 |
$371 |
$135,380 |
5% |
|
TAS |
$432 |
$129 |
$561 |
$204,710 |
19% |
|
NT |
$225 |
$104 |
$329 |
$120,050 |
7% |
|
ACT |
$523 |
$158 |
$681 |
$248,565 |
77% |
|
AUS |
$295 |
$110 |
$405 |
$147,890 |
32% |
![]()
8 Ibid.
9 Ibid, Table 8A.19.
The costs of prisons can be broken down into capital (fixed) and operating (ongoing) costs. On average across Australia, 73 per cent of total costs are ongoing.10 This includes expenditure on items such as staffing and maintenance. The marginal costs differ greatly across the country, ranging from $523 per prisoner per day in ACT to
$225 in NT and SA.11 Since 2015, the ACT saw the greatest growth in net operating costs with a 77 per cent increase.
It should be noted that one extra prisoner will not increase costs to government by $147,900. Adding more prisoners will, to a point, reduce the average costs of
incarceration because the fixed costs (such as a prison) would be averaged across a larger number of prisoners. It is the operating costs, on average, that will increase:
$295 prisoner per day, or about $108,000 per year.12
However as prison numbers increase more prisons need to be built or existing prisons expanded. Utilisation is defined by the Productivity Commission as the annual daily average prisoner population as a percentage of the number of single occupancy cells and designated beds in shared occupancy cells provided for in the design capacity of the prisons.13 Currently prison utilisation rates are estimated to be quite high, from about 85 per cent in Tasmania to 115 per cent in the NT.14 Being over 100 per cent
of capacity raises the issue of further construction of prisons or expansion of existing prisons to house more inmates.
Chart 2: Prison utilisation rates
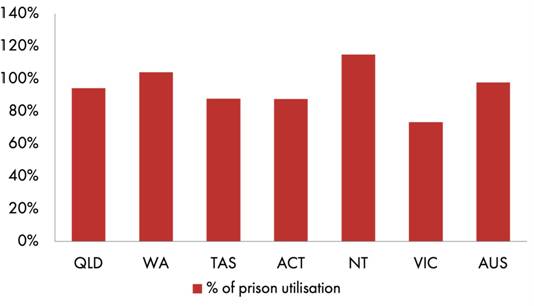
Source: Productivity Commission Annual Report on Government Services 2023
![]()
10 Ibid, Table 8A.1.
11 Ibid.
12 Ibid.
13 Ibid.
14 Ibid, Table 8A.15.
The creation of new prisons and expansion of existing prisons can be expensive. Chisholm Road Prison is currently under construction in the Barwon Southwest region as part of the $1.8 billion in new spending on Victoria’s prisons and corrections system announced in the 2019-20 Budget. This project was developed in response to Victoria’s largest prison, Ravenhall Correctional Centre, reaching capacity. Despite investing
$670 million on expanding Ravenhall Correctional Centre for the second time, the prison reached capacity in less than two years after reopening. It is estimated that the Barwon Southwest prison will cost $6.3 billion to operate over the next 25 years. In New South Wales, Australia’s largest and most expensive prison was opened in
2020, costing $798 million to build. In its first year of operation, the prison population grew from just 90 prisoners to over 1,100 prisoners. This marks 65 per cent of the prison’s maximum capacity - reached in just one year. In South Australia, modelling has projected that 800 more prison beds will be needed before 2030 in order to house the growing prison population. The South Australian Government has announced a new prison is to be built to meet this demand. Correctional Services have received $2 million in funding to complete a full strategic business case to develop the new prison.
Trends in incarceration
One of the main drivers of increased criminal justice costs across Australia is a rise in the number of people incarcerated. In this section we outline the increase in incarceration and examine the characteristics of the prison population.
The growing prison population
Over the past several decades the number of people incarcerated in Australia has increased rapidly. In 1975 there were 8,900 people in jail nation-wide.15 By 2022 that number had risen to over 40,500—an increase of more than 355 per cent.16 Over this same period the total population grew by just over 83 per cent,17 resulting in an attendant rise in the incarceration rate to 205 per 100,000 adult population.
Chart 3: Incarceration per 100,000 of the total adult population
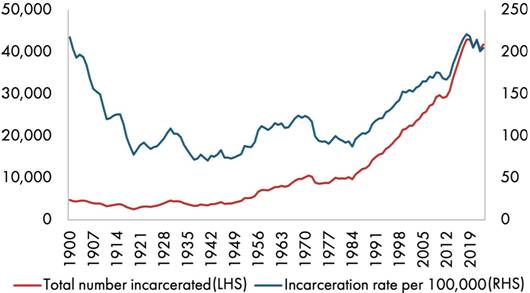
Source: Australian Bureau of Statistics Prisoners in Australia 2022 and Australian Bureau of Statistics Corrective Services 2023.
![]()
15 Andrew Leigh, ‘Estimating Long-Run Incarceration Rates for Australia, Canada, England & Wales, New Zealand and the United States’ (Discussion Paper No 13024, Institute of Labor Economics, March 2020) <https://docs.iza.org/dp13024.pdf>.
16 Australian Bureau of Statistics, Prisoners in Australia 2022 (Catalogue 4517.0, 24 February 2023) Table 1.
17 Australian Bureau of Statistics, National, State and Territory Population September 2022 (Catalogue 310101, 16 March 2023).
When compared internationally, Australia has one of the highest incarceration rates. Australia had the third highest imprisonment growth rate of all 38 OECD countries behind only Turkey and Columbia over the 15-year period from 2003-2018.18 Compared to other Commonwealth countries with similar legal systems, Australia’s incarceration rate is higher than that of the United Kingdom and Canada.19 Of course, a lower incarceration rate is not good in and of itself. It is necessary to analyse the cost of incarceration along with the comparative crime rate. In Australia the incarceration rate along with the cost of incarceration is ever increasing despite a decline in crime rates. This will be further explored later in the report.
Effect of covid-19 on incarceration
It must be noted that the various government restrictions implemented across states and territories due to covid-19 from early 2020 to 2022 had an impact on criminal activity and the justice system. This increase in regulation, and the consequential increase in fines and arrests issued in response to breaches of this regulation, led to an influx of cases brought before the court system.
However, the government-imposed restrictions also resulted in a backlog of the justice system as court sittings were delayed and/or suspended.20 The influx of new cases coupled with court delays has meant that the full effect on incarceration trends over previous years has not yet been reported. Many offenders who would have otherwise already been processed are still awaiting trial and sentencing as the court begins to process the backlog of offenders. This would explain the slight decline in incarceration rates over the past couple of years.
18 Productivity Commission, Australia’s Prison Dilemma (Research Report, October 2021) <https://www.pc.gov.au/ research/completed/prison-dilemma/prison-dilemma.pdf>.
19 Andrew Leigh, ‘Estimating Long-Run Incarceration Rates for Australia, Canada, England & Wales, New Zealand and the United States’ (Discussion Paper No 13024, Institute of Labor Economics, March 2020) <https://docs.iza. org/dp13024.pdf>.
20 Australian Bureau of Statistics, Criminal Courts, Australia 2021-22 (Catalogue 4513.0, 3 March 2023).
Incarceration by state

There is a substantial difference in the incarceration rate across the states and territories. The Northern Territory has by far the highest rate at 1066, while Australian Capital Territory has the lowest rate at 109.21 The main demographic reason for this is the relatively large proportion of Indigenous Australians in the NT, who are substantially overrepresented in prison. Western Australia and Queensland’s incarceration rate
is elevated compared to the national average, while Tasmania, Victoria and The Australian Capital Territory hold rates below the national average. New South Wales and South Australia each have rates close to the national average.22
There has also been a significant fluctuation in changes to the incarceration rate across the states. Whilst SA saw the largest increase in rate at 65 per cent during the decade preceding 2015, this rate has slowed over previous years and now sits just below the national average at a 4 per cent rate increase. The NT however has consistently held one of the highest increases in rate and has seen a rise of approximately four times that of the average national rate.23 From the period of 2015-2023 Queensland saw the largest increase in incarceration rate with a 23 per cent growth rate from 198 to 243.24 Notably, despite spending the more than any other state on prison running costs, the ACT held the largest decline in prisoner numbers. The incarceration rate in the ACT dropped by 17 per cent since 2015.25
21 Australian Bureau of Statistics, Corrective Services, Australia 2023 (Catalogue 4512.0, March 2023) Table 3.
22 Ibid.
23 Ibid.
24 Ibid.
25 Ibid.
Table 2: Incarceration rates by state per 100,000 adults26
|
|
NT |
WA |
QLD |
SA |
NSW |
TAS |
VIC |
ACT |
AUS |
|
Adult Incarceration Rate (2015) |
885 |
278 |
198 |
204 |
200 |
130 |
134 |
131 |
196 |
|
Adult Incarceration Rate (2023) |
1,066 |
293 |
243 |
213 |
196 |
153 |
127 |
109 |
205 |
|
Growth Rate |
20% |
5% |
23% |
4% |
-2% |
18% |
-5% |
-17% |
5% |
Chart 4: Incarceration rates by state per 100,000 adults
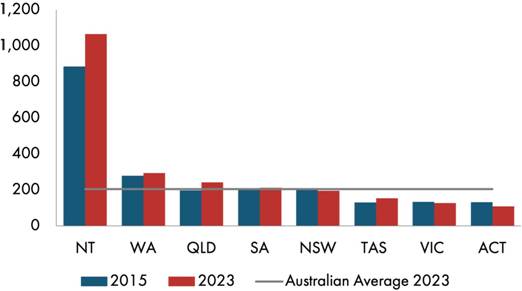
Source: Australian Bureau of Statistics Corrective Services 2023 and 2015.
Incarceration of low-risk, non-violent offenders

People are incarcerated for a wide range of crimes, from homicide and assault through to drug use and traffic offences. In 2022 the majority of people were in prison for relatively serious offences, such as acts intended to cause injury and sexual assault and related offences.27
The limitations in interpreting prisoner data by offence type must be noted. This information is provided by most serious offence type. This means the actual number of people incarcerated who have been convicted of a given crime is not publicly reported. For example, many offenders who have been incarcerated for assault might also be guilty of another offence, such as breaking and entering or drug use. But the only statistic recorded is their most serious offence. Thus this data provides an incomplete picture of the crimes committed by those in prison. However, for the purposes of this report it is only necessary to record the worst offence for which an
offender has been charged to distinguish between offenders who have committed at least one violent offence and those who have not.
Violent, non-violent,
and property
offences
In categorising the prison population by crime type we follow definitions provided by the ABS.28 Violent offences committed against a person are defined as acts that:
• relate to culpable (i.e. intentional, negligent or reckless) acts that result in harm (i.e. physical injury/violation, or non-physical harm). These acts are not necessarily completed; they include attempts and conspiracies.
• must affect a specific person as opposed to the general public. That is, the victim(s) can only ever be a distinct person or persons. Thus, the acts cannot be committed against organisations, the state or the community.
27 Australian Bureau of Statistics, Prisoners in Australia 2022 (Catalogue 4517.0, 24 February 2023) Table 1.
28 Australian Bureau of Statistics, Australia and New Zealand Standard Offence Classification (Catalogue 1234.0, 2 June 2011).
Violent offences are categorised as homicide and related offences; acts intended to cause injury; sexual assault and related offences; dangerous or negligent acts
endangering persons; abduction, harassment and other offences against the person; and robbery, extortion and related offences
Non-violent offences are generally classified as offences against organisations, government (local, state or federal) and the community in general, rather than against particular individual persons, such as illicit drug offences; prohibited and regulated weapons and explosives offences; public order offences; traffic and vehicle regulatory offences; offences against government procedures, government security and government operations; and miscellaneous offences.
Property offences are also included for our purposes in the non-violent category as they do not generally involve an offence against another person. They include
unlawful entry with intent/ burglary, break and enter; theft and related offences; fraud, deception and related offences; property damage and environmental pollution.
There are two important limitations to these definitions.
One is that these categories are not always cleanly separated into violent and non- violent offences. For example robbery, extortion and related offences includes both armed robbery (a violent offence) together with demands made via a letter (non- violent). So there may be some people counted in the non-violent category whose crimes involved some violence.
The other is that a non-violent offence, like a weapon, drug, or traffic offence may still pose a danger to other people. While these offences do not involve harm, or the threat of harm, to another individual they may put others at risk, whether intentionally
or unintentionally. Unlike with a violent offender, however, the risk to others entailed by these offences is not necessarily inherent in the offender, who is therefore less likely to need to be isolated from the community.
Based on these definitions, in 2022 about 62 per cent of those in prison had committed a violent crime against a person; 14 per cent had committed a property crime; and 24 per cent a non-violent crime.29
29 Australian Bureau of Statistics, Prisoners in Australia 2022 (Catalogue 4517.0, 24 February 2023) Table 1; IPA calculations.
Table 3: Prison Population 2022 by most serious offence30
|
Crime Type |
Number of Prisoners |
Proportion of Total |
|
Violent |
24,928 |
62% |
|
Non-violent (victimless) |
9,784 |
24% |
|
Non-violent (property) |
5,772 |
14% |
|
Non-violent (total) |
15,556 |
38% |
Chart 5: Sentenced prisoners by type of offence
Whilst non-violent incarcerations have fallen in recent years, the Australian Bureau of Statistics notes that the various restrictions imposed by Australian governments across state and territories in response to covid-19 may be continuing to have an impact on criminal activity and the justice system.31 As people spent the majority of these years in their homes, we saw a reduction in criminal acts such as break-ins and traffic offences.
30 Ibid.
31 Australian Bureau of Statistics, Prisoners in Australia 2022 (Catalogue 4517.0, 24 February 2023).
Calculating the cost of incarcerating non-violent offenders
We can combine data on the incarceration of non-violent offenders outlined above with our earlier data about the cost of incarceration to produce an approximate figure for the amount spent annually nationwide and in each state on locking up non-violent offenders.
Table 4: Annual cost of incarceration of non-violent offenders32
|
|
Non-violent offenders incarcerated (2022) |
Annual cost per prisoner |
Total cost of incarceration of non-violent offenders |
Growth in total cost since 2015 |
|
NSW |
4,771 |
$153,000 |
$730m |
$248m |
|
VIC |
2,599 |
$196,220 |
$510m |
$108m |
|
QLD |
3,634 |
$124,900 |
$454m |
$96m |
|
SA |
1,292 |
$110,600 |
$143m |
$24m |
|
WA |
2,555 |
$135,300 |
$346m |
$19m |
|
TAS |
232 |
$204,700 |
$47m |
$11m |
|
NT |
462 |
$120,100 |
$55m |
$0m |
|
ACT |
139 |
$248,600 |
$35m |
$9m |
|
AUS |
15,556 |
$147,900 |
$2,300m |
$503m |
By this measure, in 2022, Australian governments spent more than $2.3 billion on the incarceration of offenders whose worst offence was a non-violent offence. Despite there being a decrease in the overall number of non-violent prisoners, almost every state increased the amount they spent on incarcerating such offenders - amounting to an excess of $503 million in spending. A one per cent shift in the number of non-violent
offenders in prison would save the taxpayer more than $23 million per year nationwide.
32 Ibid, Table 1; Productivity Commission, Annual Report on Government Services (Report, 31 January 2023) Volume C Section 8 Table 8A.19 <https://www.pc.gov.au/ongoing/report-on-government-services/2023/justice/ corrective-services>.
In interpreting this data, the following must be considered.
As previously stated, the number of non-violent offenders is an estimate based on the most serious offence for which a prisoner is currently incarcerated. Some of these people may have committed violent offences in the past or concurrent with a more- heavily punished non-violent offence. And given that 60 per cent of prisoners have been incarcerated before, many of these non-violent offenders will be recidivists, for whom alternatives to prison may be inappropriate and/or ineffective.
A more accurate calculation would require a case-by-case analysis. Should public policy be based on the distinction between violent and non-violent offenders, it will be necessary for the courts to closely enquire into the nature and circumstances of the
offending before them. Policy must be developed to ensure that the characteristics of the offender as either non-violent or violent is of paramount consideration during sentencing.
This figure includes the capital costs of building and maintaining prisons. These costs would not necessarily go down were incarceration reduced, for the reasons discussed above unless incarceration numbers were reduced to the extent that prisons could be closed or larger prisons could be replaced by smaller prisons requiring less operational costs. Moreover, it has been the experience of jurisdictions that have reduced their incarceration of non-violent offenders that some savings are offset by the need to employ more parole officers, community corrections officers, and re-entry specialists, and that prison staff numbers do not go down in strict correspondence to the reduction of the prison population because violent prisoners require the most supervision.
Nonetheless, this figure indicates that there is a prima facie case for believing that there are significant savings to be made within the criminal justice system by emphasising the distinction between violent and non-violent offenders during sentencing. Policy must be reformed so that the approach for detaining and isolating violent community threats is distinct from retributing and punishing non-violent offenders whose incarceration may not be necessary to uphold community safety.
Characteristics of prisoners in 2023
Crime tends to be committed by those of low socioeconomic status, including those with low education attainment, inconsistent work histories, lack of stable housing and substance abuse. This section provides an overview of the characteristics of prisoners. While these markers should not be read as causing crime, much less excusing it, they are important to understand in developing appropriate policy responses to the elevated incarceration rate.
Education attainment
• Lower education attainment is correlated with higher crime and incarceration rates;
• Almost 2 in 3 Australian prisoners have an education level of Year 8 or below;33 and
• 80 per cent of prisoners have left formal schooling before completing Year 12.34
Employment
• Prison entrants are likely to have patchier work histories than the general population and are less likely to be working immediately prior to entering prison;
• More than half of prison entrants were reportedly unemployed during the 30 days before prison; and
• Less than 1 in 4 of prison dischargees reported they had paid employment organised to start after release from prison.
Housing
• Many studies have found that a large minority of former prisoners are without stable housing when released;
• Approximately a quarter of those entering prison were homeless or in short-term or emergency accommodation; and
• Released prisoners without stable housing are more likely to reoffend and return to prison.
33 Australian Institute of Health and Welfare, Australia’s Welfare 2021: Adult Prisoners (Report, 16 September 2021)
<https://www.aihw.gov.au/reports/australias-welfare/adult-prisoners>.
34 Ibid.
Health
• Prisoners have higher levels of mental health problems, risky alcohol consumption, tobacco smoking, illicit drug use, chronic disease and communicable diseases than the general population;35 and
• 40 per cent of prison entrants have reported a previous diagnosis of a mental health disorder, including alcohol and drug misuse.36
Age and gender
• Imprisonment is overwhelmingly a young male phenomenon. About 93 per cent of those in prison in 2022 were male and over 50 per cent were under 35 years old. The ratio of male/female imprisonment has been roughly constant over the past decade, with the number of female prisoners remaining below 10 per cent.37
35 Ibid.
36 Ibid.
37 Australian Bureau of Statistics, Prisoners in Australia 2022 (Catalogue 4517.0, 24 February 2023) Table 4.
Crime, offenders, reoffenders, and victims

When interpreting crime data and the possible explanations for the change in crime over time, it is important to remember that data is limited, and sometimes patchy and inconsistent across jurisdictions. And even in a world of perfect data the actual crime rate would never be known because many crimes are unreported.38 The ABS has summarised some of the data issues:
When examining our statistics it must be remembered that not every crime is reported to the police, not every crime that is reported is recorded, not every crime that is recorded is investigated, not every crime that is investigated is cleared (‘solved’), not every crime that is investigated yields a suspect, not every suspect is apprehended, not every apprehended person is charged, not every charged person is brought before the courts, not every person brought before the courts is convicted, and not every convicted person is imprisoned.
So then, taking a snapshot at any time, or taking a series of data over time on any activity (e.g. court appearances, prisoner numbers, etc.) does not tell us about crime in Australia, but rather about that particular activity or segment.39
No matter which way the data is analysed, an objective understanding of the crime rate is difficult to obtain. For example, the public data available includes:
•
The
number of offenders; but this does not provide information on the number of
crimes committed per
offender.
38 Although this would only affect the absolute numbers of crime reported. Provided errors in reporting (such as underreporting or misreporting) were similar across time, analysis of growth rates or relative changes to crime rates would not be affected.
39 Australian Bureau of Statistics, Year Book Australia 2001 (Catalogue 1301.0, 25 January 2001) Table C8.11.
• The number of proceedings made by police per offender; but this doesn’t include the number of alleged crimes per proceeding.
• The number of victims; but this doesn’t include victimless crimes or the number of crimes committed against a given victim.
Additionally, the majority of data is not available over long time periods, so it can be difficult to draw strong conclusions about longer run trajectory of the crime rate.
With these limitations in mind it appears that:
• the overall offender rate has been steadily declining
• the adult offender rate has decreased
• the number of proceedings per offender has remained stable, and
• the victimisation rate has decreased.
Number of offenders
In 2021-22 there were approximately 369,000 offenders nation-wide. About 82 per cent, or 301,000, were adults and about 18 per cent, or 68,000, were juveniles.40 The total number of offenders has been on a steady decline since it’s spike in 2015-16. The number of adult offenders has declined by over 29,000.
Table 5: Offender rates Australia41
|
Year |
No. offenders (total) |
No. offenders (adult) |
Offender rate (per 100,000 total population) |
Adult offender rate (per 100,000 adult population) |
|
2011-12 |
382,098 |
279,667 |
1,945 |
1,648 |
|
2012-13 |
397,663 |
299,971 |
1,991 |
1,736 |
|
2013-14 |
409,896 |
317,398 |
2,021 |
1,807 |
|
2014-15 |
413,775 |
324,187 |
2,011 |
1,817 |
|
2015-16 |
418,352 |
330,442 |
2,005 |
1,821 |
|
2016-17 |
413,894 |
328,681 |
1,949 |
1,778 |
|
2017-18 |
406,767 |
324,554 |
1,883 |
1,727 |
|
2018-19 |
394,638 |
317,821 |
1,795 |
1,663 |
|
2019-20 |
374,645 |
302,862 |
1,677 |
1,560 |
|
2020-21 |
359,975 |
293,454 |
1,599 |
1,518 |
|
2021-22 |
369,488 |
301,045 |
1,632 |
1,529 |
40 Australian Bureau of Statistics, Recorded Crime – Offenders 2022 (Catalogue 4519.0, 9 February 2023) Table 3.
41 Ibid; IPA calculations.
Table 6: Offender rates per 100,000 total population separated by state and territories42
|
|
NSW |
VIC |
QLD |
SA |
WA |
TAS |
NT |
ACT |
AUS |
|
2014-15 |
1,891 |
1,556 |
2,362 |
3,186 |
1,760 |
2,392 |
5,719 |
806 |
2,011 |
|
2021-22 |
1,892 |
1,297 |
1,762 |
1,573 |
1,434 |
1,536 |
4,062 |
586 |
1,632 |
|
Growth Offender Rate |
0% |
-17% |
-25% |
-51% |
-19% |
-36% |
-29% |
-27% |
-19% |
Every state and territory, apart from New South Wales, has seen a decline in their overall offender rate per 100,000 of the total population. Despite this every state, apart from NSW, Victoria, and the ACT, increased their number of incarcerations. Each state and territory also increased the amount they spent on prisons.
Chart 6: Adult offender rate versus incarceration rate

Source: Institute of Public Affairs calculations using Australian Bureau of Statistics Recorded Crimes – Offenders 2022
42 Australian Bureau of Statistics, Recorded Crime – Offenders 2022 (Catalogue 4519.0, 9 February 2023) Table 6.
Whilst the adult offender rate a decade ago was rising along with the incarceration rate, in recent years the adult offender rate has dropped whilst the incarceration rate has remained elevated. Several factors must be considered here.
Firstly, whilst the overall number of offenders has decreased, of those committing offences a higher proportion are being sentenced to prison. This has maintained the increasing incarceration rate.
Secondly, the last decade has seen rapid technological advancements which has increased the prevalence of casual surveillance in the form of security cameras and recording devices. With this increase in surveillance comes the increase in likelihood of getting caught for committing an offence. Whilst long and strict prison sentences have been justified as a mode of deterrence in the past, studies have shown that people do not limit their criminal behaviour based on the severity of potential sentences, but rather on the likelihood of getting caught and facing any form of retribution.43 Due to the
fact that the general public’s knowledge of criminal sanctions is often limited, the very nature of an act being criminalised is often enough to deter people from offending.44 Thus as the chance of getting caught and facing some form of penalty has increased over recent years, there has been a decline in the number of offences committed.
Despite this evidence that the use of prison sentences cannot be justified as the sole deterrent of criminal behaviour, incarceration numbers and spending on prisons continues to climb.
43 Marta Nelson, Samuel Feineh and Maris Mapolski ‘A New Paradigm for Sentencing in the United States’ (Research Report, Vera Institute of Justice, February 2023) <https://www.vera.org/downloads/publications/Vera- Sentencing-Report-2023.pdf>.
44 Ibid.
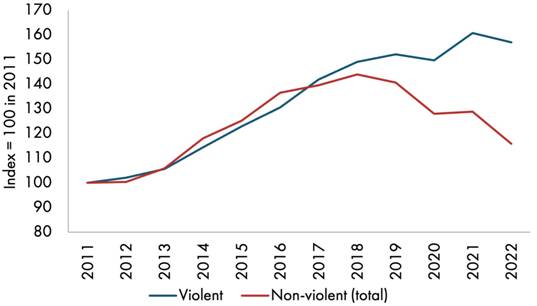
Chart 7: Number of offenders by offence type

The number of violent offenders has steadily increased over the past decade whilst the number of non-violent offenders has followed an overall trend of decline. The various restrictions imposed across Australia in response to covid-19 must be considered in analysing these trends. As people spent the majority of time in their homes there was a reduction in certain criminal behaviour such as break-ins as police were enforcing rules such as stay at home orders. The influx in 2020-21 of non-violent offenders may
be due to the 68,791 offenders who were proceeded against for at least one covid-19 related offence.45 The majority of these offenders, 68 per cent, were proceeded against in New South Wales.
However, the offender rate cannot give an entire explanation of the crime rate. This is because a given offender can commit more than one crime, so knowing the number of crimes committed per offender is an important piece of information. Unfortunately, the data on the number of crimes per offender is not publicly available. But the number of proceedings made by police per offender is available, which can be used as a rough proxy for the crime rate. The table below gives the average number of proceedings made by police per offender by state (data for WA isn’t available).
45 Australian Bureau of Statistics, Recorded Crime – Offenders 2022 (Catalogue 4519.0, 9 February 2023).
Table 7: Mean number of proceedings per offender46
|
|
NSW |
VIC |
QLD |
SA |
TAS |
NT |
ACT |
|
2014-15 |
1.7 |
1.5 |
1.7 |
1.3 |
1.4 |
1.8 |
1.2 |
|
2015-16 |
1.8 |
1.5 |
1.8 |
1.3 |
1.5 |
1.9 |
1.2 |
|
2016-17 |
1.9 |
1.5 |
1.8 |
1.3 |
1.5 |
1.9 |
1.3 |
|
2017-18 |
1.9 |
1.5 |
1.8 |
1.4 |
1.6 |
1.8 |
1.3 |
|
2018-19 |
1.9 |
1.5 |
1.8 |
1.4 |
1.6 |
1.6 |
1.3 |
|
2019-20 |
1.9 |
1.6 |
1.9 |
1.5 |
1.6 |
1.5 |
1.4 |
|
2020-21 |
1.8 |
1.7 |
1.8 |
1.4 |
1.6 |
1.5 |
1.4 |
|
2021-22 |
1.8 |
1.5 |
1.8 |
1.4 |
1.7 |
1.5 |
1.4 |
The average number of proceedings per offender has increased since 2014-15 in NSW, QLD, SA, TAS and the ACT, stayed flat in Victoria and decreased in the NT. Using a weighted average, we estimate that the national average police proceedings per offender has remained consistent since 2014-15 and remains to be 1.6.
The graph below plots the estimated crime rate, which is the number of offenders multiplied by the average number of proceedings per offender. Again, whilst the crime rate followed a similar relationship to the incarceration rate about seven years ago, recent years have seen a drastic drop in the number of crimes being committed. One would expect that the reduction in crime would result in fewer incarcerations and less spending on prisons. However, the opposite has occurred as government spending on prisons has continued to increase.
Chart 8: Crime rate and incarceration rate

Source: Institute of Public Affairs calculations using Australian Bureau of Statistics Recorded Crime – Offenders 2022
46 Ibid, Table 27-33.
Chart 9: Crime rate and police presence

Source: Institute of Public Affairs calculations using Australian Bureau of Statistics Recorded Crime – Offenders 2022 and Productivity Commission Report on Government Services 2023
The crime rate has seen a reduction as the number of police staff has increased. Since 2014-15, over 10,000 police staff have been added to the Australian police force.
Spending on police presence has also increased over this period with an additional
$3 billion invested in police services.47 In 2014-15 real recurrent expenditure on police services was $11.7 billion and in 2021-22 this expenditure increased to $14.8 billion.48 This provides further support for the evidence that as the number of police is increased, so is the fear of apprehension in an offender’s mind that they will be caught for committing an offence thus reducing the incidence of crime.
Victims
The number of victims has declined by 10 per cent since 2014/15. In 2021/22 approximately 670,000 people were victims of a crime compared to 750,000.49 Crimes included are: homicide, sexual assault, kidnapping, robbery, blackmail/ extortion, unlawful entry with intent, motor vehicle theft and other theft. Unfortunately, ABS data for assault is only for certain states, which does impose a limitation on our interpretation of the overall number of victims given assaults are not a trivial occurrence.
47 Productivity Commission, Annual Report on Government Services (Report, 31 January 2023) Volume C Section 6
<https://www.pc.gov.au/ongoing/report-on-government-services/2023/justice/police-services>.
48 Ibid.
49 Australian Bureau of Statistics, Crime Victimisation, Australia 2021-22 (Catalogue 4530.0, 22 February 2023).
The victimisation rate—the number of reported victims as a percentage of the population— has decreased for a number of crimes from 2014/15 to 2021/22, for example:
• face-to-face threatened assault has decreased from 2.6 to 2.2;
• non face-to-face threatened assault has decreased from 1.1 to 0.7;
• break-ins are down from 2.7 to 2.0;
• malicious property damage is down from 5.7 to 3.8; and
• robbery is relatively flat at 0.3.
However, the number of victims of violent crimes such as sexual assault has increased from 0.3 to 0.5.
Chart 10: Personal crime victimisation rate as percentage of Australian population

Source: Australian Bureau of Statistics Crime Victimisation, Australia 2021-22
Changes in recording and reporting make it difficult to compare data over time and across jurisdictions, as can changes in the prevalence of reporting amongst victims.
The decline in the number of victims can be partly explained by the decline in the number of offences being committed. However, the sharp rise in the imprisonment rate indicates that a portion of offenders are potentially being incarcerated for victimless crimes. A primary justification for the use of prison sentences is keeping the community safe from harmful offenders. However, if the offenders are not posing a threat to community safety, in that there is no victim of their conduct, other responses should be implemented to penalize criminal behaviour which also save taxpayer expenses.
Of those victims of crime, many have vocalised their discontent with Australia’s “tough on crime” rhetoric calling for tangible support and processes which address the causes of offending.50 The current reliance on incarceration as a means of providing retribution for
![]()
50 The Justice Reform Initiative, ‘State of Incarceration: Insights into Imprisonment in Victoria’ (Research Paper, March 2023) <https://assets.nationbuilder.com/justicereforminitiative/pages/346/attachments/original/1679868617/ JRI_Insights_VIC_EMBARGOED_220323.pdf?1679868617>.
victims of crime falsely relies on the assumption that a victim’s suffering cannot be alleviated unless the offender is punished by a loss of freedom. However, many have instead emphasised their desire for Restorative and Transformative Justice processes that see the root of offending addressed as well holding offenders accountable for their actions.51
Reoffending rates
Approximately 60 per cent of the prison population has been incarcerated more than once.52 This is the highest the reoffending rate has been in the past decade despite the overall offender rate decreasing. Thus, more than half of the prison population are choosing to recommit crimes despite serving time behind bars for their earlier offences. Annually, Australian governments are spending over $3.6 billion on incarcerating offenders who have previously been imprisoned.
Chart 11: Percentage of prisoners who have been imprisoned before

Source: Australian Bureau of Statistics Prisoners in Australia 2022
This suggests that the poor performance of prisons in preventing re-offending is one of the drivers of the growing incarceration rate in the sense that if they were performing better the overall growth would be lower (all else being equal). In a study conducted by the Productivity Commission, it was found that Australia has one of the highest reimprisonment rates internationally sitting only behind the USA.53
51 Ibid.
52 Australian Bureau of Statistics, Prisoners in Australia 2022 (Catalogue 4517.0, 24 February 2023).
53 Productivity Commission, ‘Australia’s Prison Dilemma’ (Research Report, Australian Government, October 2021)
<https://www.pc.gov.au/research/completed/prison-dilemma/prison-dilemma.pdf>.
For most of those who are jailed multiple times, their return comes quickly. Nationally
45.2 per cent of prisoners released in 2020-21 returned to prison within two years.54 This indicates that a significant portion of the prison population are stuck in a cycle of imprisonment, release, and reoffending.
This data suggests that prisons are failing to meet the objectives of the criminal justice system. The fact that many prisoners are released and then go on to reoffend indicates a systemic breakdown in the justice system’s ability to produce law-abiding individuals and ensure community safety. Decreasing the number of reoffenders would make a substantial contribution to limiting the growth of the incarceration rate.
Table 8: Percentage of prisoners who have been imprisoned before by state55
|
|
NT |
WA |
QLD |
SA |
NSW |
TAS |
VIC |
ACT |
AUS |
|
2011-12 |
68% |
57% |
60% |
51% |
52% |
61% |
48% |
71% |
55% |
|
2021-22 |
74% |
62% |
68% |
53% |
56% |
67% |
53% |
77% |
60% |
|
Growth |
6% |
5% |
8% |
2% |
4% |
6% |
5% |
6% |
5% |
Each of the states and territories have all seen an increase in the percentage of prisoners who have been imprisoned before. Queensland saw the greatest increase in growth of reoffenders returning to prison over the past decade.
Average sentences have gotten longer
Over the past decade, average sentence lengths for Australian prisoners have increased. The mean sentence length has increased by almost 14 per cent to 14.8 months and the median sentence length has grown by 30 per cent to 8 months.56
54 Productivity Commission, Annual Report on Government Services (Report, 31 January 2023) Volume C Table CA.4
<https://www.pc.gov.au/ongoing/report-on-government-services/2023/justice/corrective-services>.
55 Australian Bureau of Statistics, Prisoners in Australia 2022 (Catalogue 4517.0, 24 February 2023) Table 29.
56 Australian Bureau of Statistics, Criminal Courts, Australia 2021-22 (Catalogue 4513.0, 3 March 2023) Table 6
Chart 12:
Sentence Lengths
in
Australia

Source: Australian Bureau of Statistics Criminal Courts, Australia 2012 and 2022
This
trend reflects
the shift
in more
violent offenders
being convicted
and making
up a larger
percentage of
the prison
population as
violent crimes
tend to
receive longer sentences.
This also reflects the increase in reoffenders returning to prison as
harsher
penalties
are imposed
for repeat
offences. Longer
prison sentences
contribute to
the
overall
growth
in
imprisonment.
Harmful effects of short prison sentences
Although sentence lengths have increased, a significant proportion of convicted prisoners receive short prison sentences. More than a third receive a prison sentence of less than 6 months and almost 60 per cent receive a sentence length of less than a year.57 The majority of prisoners (66 per cent) serving short sentences are in prison for non-violent offences.58
Research conducted by the Productivity Commission notes that high recidivism is associated with frequent and short sentences.59 Many prisoners report that they have lost their jobs and/or housing as a result of their imprisonment. Hence, they experience greater instability upon release which in turn drives reoffending.60 Registration in rehabilitative programmes administered through prison can often take time and prisoners may face delays. Therefore, those who are incarcerated for a short period of time are often not registered in these rehabilitation programmes before they are released or they do not participate for a sufficient length of time so the rehabilitative effects are not felt.61 This lack of rehabilitation coupled with the disruptive effects of any prison sentence makes short prison sentences particularly harmful for offenders and increases the likelihood that they will reoffend.
![]()
57 Ibid.
58 Ibid.
59 Productivity Commission, ‘Australia’s Prison Dilemma’ (Research Report, Australian Government, October 2021)
<https://www.pc.gov.au/research/completed/prison-dilemma/prison-dilemma.pdf>.
60 Julie Trebilcock, ‘No Winners: The Reality of Short Term Prison Sentences’ (Research Report, The Howard League for Penal Reform, March 2016) <https://howardleague.org/wp-content/uploads/2016/03/No-Winners.pdf>.
Chart 13: Percentage of finalised defendants by sentence length in Australia 2022

Source: Australian Bureau of Statistics Criminal Courts, Australia 2021-22
Despite the overall number of non-violent offenders decreasing since 2014-15, the number of non-violent offenders receiving a prison sentence increased by almost 2,000. One would expect the number of people sentenced behind bars to decrease as the number of offenders in the community does, however this has not occurred. This reveals that sentencing attitudes are not adapting or responding to changes in crime trends across Australia.
Reform directions
Whilst prison populations grow so do attendant costs. Up to 38 per cent of those in prison have been incarcerated for a non-violent offence. Policy reform must ensure that all resources devoted to the criminal justice system are used efficiently and beneficially with prison being used for its primary purpose – protection of the community.
Punishment reform for non-violent offenders
Those who do not pose a threat to community safety should be subject to proportionate punishments other than incarceration. Many non-violent offenders do not pose
a physical threat to the community and thus they need not be isolated though imprisonment. They should instead be subject to punishments which can be imposed to a degree sufficient to deter reoffending just as effectively as a prison sentence. In
fact, as explored earlier, the theory that incarceration serves as a deterrent for criminal behaviour has been disproved.62 The general public’s understanding of criminal sanctions is often limited and thus the very nature of an act being prohibited by law, and the possibility of facing any form of punishment, is often enough to deter offenders.63
Alternatives to prison
This is not to say that non-violent criminal behaviour should not be punished. It is important that offenders face repercussions for their criminal actions. However there are alternative sanctions that can be imposed which proportionately punish offenders whilst also reduce costs for taxpayers so that they too are not also punished by incarceration.
Offender employment programmes
Non-violent low-risk offenders should be eligible to work for willing business at award rates in sectors experiencing labour shortages.64 Rather than being a burden on taxpayer funds, these non-violent offenders should be working, paying tax and helping to reduce the inflation-inducing labour shortage in Australia.65 Employers would have full knowledge of the offender’s criminal history and the program would function similar to community- based orders, however offenders would be paid award wages and work full-time.66
![]()
62 Marta Nelson, Samuel Feineh and Maris Mapolski ‘A New Paradigm for Sentencing in the United States’ (Research Report, Vera Institute of Justice, February 2023) <https://www.vera.org/downloads/publications/Vera- Sentencing-Report-2023.pdf>.
63 Mirko Bagaric, ‘Australia’s Emerging Incarceration Crisis: Proposed Reforms of the Australian Sentencing System’ (Research Paper, Institute of Public Affairs, October 2022) < https://ipa.org.au/ipa-today/australias-emerging- incarceration-crisis-proposed-reforms-of-the-australian-sentencing-system>.
64 Mirko Bagaric and Morgan Begg, ‘Let Them Work: How Criminal Justice Reform Can Help Address Australia’s Worker Shortage’ (Research Paper, Institute of Public Affairs, 10 March 2023) <https://ipa.org.au/ipa-today/let- them-work-how-criminal-justice-reform-can-help-address-australias-worker-shortage>.
65 Ibid.
66 Ibid.
Financial sanctions
Many crimes are motivated by financial interests. That is why a financial sanction should be imposed for non-violent criminals to deter motivation of financial gain. Offenders should be subjected to a property ownership disqualification which prevents them from owning or possessing any assets for either a specified time or forever.67 Alternatively, an offender taxation levy could be imposed which would operate so that two-thirds of all income derived by the offender would be payable as taxation.68 The total owed would be double the amount wrongfully attained.69 Not only would this reduce the burden of incarceration costs on law-abiding taxpayers, it would also see offenders financially contribute to society.
Technological advancements
Technological incarceration should also be advanced as a criminal sanction.70 The advantage of this sanction is that the physical parameters and restrictions imposed on an offender can be tailored to the offence committed so that it is proportionate and limits the ability of the offender to reengage in offending. Tamper proof sensor equipment and visual recording equipment could be attached to offenders to monitor their movements and send an alert if they were to engage in any suspicious behaviour (such as applying significant force to an object).71
Reallocation of resources
The taxpayer funds saved from reducing incarceration costs could therefore be redirected to other criminal resources which serve to limit the incidence of crime and thus the number of victims suffering from offences. One such resource would be police. When contemplating an offence, offenders consider the possibility of apprehension into their decision making.72 If the likelihood of apprehension is high, they often withdraw from committing the offence. Therefore if police presence was increased, and hence so was the fear of apprehension, the incidence of crime would decrease.
67 Mirko Bagaric, ‘Australia’s Emerging Incarceration Crisis: Proposed Reforms of the Australian Sentencing System’ (Research Paper, Institute of Public Affairs, October 2022) < https://ipa.org.au/ipa-today/australias-emerging- incarceration-crisis-proposed-reforms-of-the-australian-sentencing-system>.
68 Ibid.
69 Ibid.
70 Ibid.
71 Ibid.
72 Marta Nelson, Samuel Feineh and Maris Mapolski ‘A New Paradigm for Sentencing in the United States’ (Research Report, Vera Institute of Justice, February 2023) <https://www.vera.org/downloads/publications/Vera- Sentencing-Report-2023.pdf>.
Conclusion
The prison population across Australia has more than doubled in less than four decades with 40,591 people behind bars. Of these prisoners, 38 per cent have committed non-violent offences. Each year, the taxpayer spends over $2.3 billion on incarcerating these offenders posing low risk to community safety.
The crime landscape across Australia has changed. Yet, despite the overall number of victims of crime declining along with the number of people committing offences, Australia continues to increase the number of offenders it imprisons. These frequent and short sentence lengths are contributing to a reoffending crisis in Australia with over 60 per cent of the prison population having been there before. This ranks Australia as one of the highest countries for reimprisonment numbers internationally. Research shows that incarceration inhibits an offender’s ability to rehabilitate into the community post- sentence and increases the likelihood of reoffending.
Australia should decrease spending of taxpayer funds on the imprisonment of non- violent low risk criminals which is only contributing to high reoffence trends. Instead, resources should be directed toward alternative deterrence mechanisms which keep the community safe. Research shows that the severity of a punitive measure is not what deters criminal behaviour, but the fact that an act is prohibited and the chances of getting caught are high is what reduces crime. Hence, governments should redirect resources saved from incarcerating fewer criminals to the police, strengthening their capacity to deter and detain criminals. Policy should be amended to extend the use of alternative punishments such as electronic home monitoring and fines and introduce tax penalties for white collar crimes such as fraud. Further, low-risk non-violent offenders should be able to substitute their imprisonment term for a community-based sanctions in the form of full-time employment to help off-set the Australia labour shortage. Through the use of alternative justice measures victims can be better compensated for their losses, criminal behaviour can be deterred, and communities can be made safer.
About the Institute of Public Affairs
The Institute of Public Affairs is an independent, non-profit public policy think tank, dedicated to preserving and strengthening the foundations of economic and political freedom. Since 1943, the IPA has been at the forefront of the political and policy debate, defining the contemporary political landscape. The IPA is funded by individual memberships, as well as individual and corporate donors.
The IPA supports the free market of ideas, the free flow of capital, a limited and efficient government, evidence-based public policy, the rule of law, and representative democracy. Throughout human history, these ideas have proven themselves to be the most dynamic, liberating and exciting. Our researchers apply these ideas to the public policy questions which matter today.
About the author
Mia Schlicht is a Research Analyst at the Institute of Public Affairs. Mia is currently studying a Bachelor of Science and a Bachelor of Law (Honours) at Monash University. Since joining the IPA, she has worked in the area of criminal justice focusing on alternatives to prison in particular for fraud offenders. Mia has a keen interest in youth justice and has spent time volunteering in the Indigenous community of Bourke, NSW working with juvenile offenders to reduce reoffending rates.
 Cl
Institute
of
Cl
Institute
of
IR Public Affairs