Annexure A
1. USA
Annexure A is an extract from Reference 3 above which evidences that the economic cost of motor vehicle crashes in the USA are exceedingly high. The 1st below bullet point equates the annual liability on a resident basis to be $784 per head of population which is 1.6% of the U.S. annual GDP:
Economic Impact of Crashes in 2010 in the USA:
■ The economic cost of motor vehicle crashes totaled $242 billion. This is equivalent to approx. $784 for every person living in the United States and 1.6% of the U.S. GDP.
■ The lifetime economic cost to society for each fatality is $1.4 million. Over 90% of this amount is attributable to lost workplace and household productivity and legal costs.
■ Each critically injured survivor (using the MAIS 5 scale) cost an average of $1.0 million. Medical costs and lost productivity accounted for 82% of the cost for this most serious level of non-fatal injury.
■ Lost workplace productivity costs totaled $57.6 billion, which equaled 24% of the total costs. Lost household productivity totaled $19.7 billion, representing 8% of the total economic costs.
■ Total property damage costs for all crash types (fatal, injury, and property damage only [PDO]) totaled $76.1 billion and accounted for 31% of all economic costs.
■ Property-damage-only crashes (in which vehicles were damaged but nobody was injured) cost $71.5 billion and accounted for 30% of total economic motor vehicle crash costs.
■ Present and future medical costs due to injuries occurring in 2010 were $23.4 billion, representing 10% of the total costs. Medical costs accounted for 21% of costs from non-fatal injuries.
■ Congestion costs, including travel delay, added fuel usage, and adverse environmental impacts cost $28 billion, or 12% of total economic crash costs.
■ Police-reported crashes account for 83% of the economic costs and 89% of total societal harm that occurs from traffic crashes. Crashes that are not reported to the police account for 17% of economic costs and 11% of total societal harm.
■ Approx. 7% of all motor vehicle crash costs are paid from public revenues. Federal revenues accounted for 4% and States and localities paid for approx. 3%. An additional 1% is from programs that are heavily subsidized by public revenues, but for which the exact source could not be determined. Private insurers pay Approx. 54% of all costs. Individual crash victims pay Approx. 23% while third parties such as uninvolved motorists delayed in traffic, charities, and health care providers pay about 16%. Overall, those not directly involved in crashes pay for over three-quarters of all crash costs, primarily through insurance premiums, taxes and congestion related costs such as travel delay, excess fuel consumption, and increased environmental impacts. In 2010 these costs, borne by society rather than by crash victims, totaled over $187 billion.
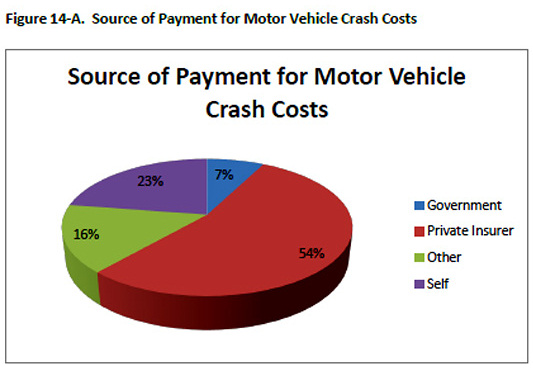
The above pie chart of the costs break up is in the above USA
study –
Reference 3