

February 2024
Copyright © 2022 Office of Responsible Gambling, Department of Enterprise, Investment and Trade, NSW Government.
Free for use in Australian schools.
Activity introduction
Quick summary
A repeated theme in these resources is: the longer you play, the more you stand to lose. While there’s arguably nothing wrong with gambling every once in a while, people have the potential to experience harm when they spend more time or money than they can afford, and ‘every once in a while’ becomes ‘any chance you have’.
Poker machines operate on the same principles as most gambling games. What separates machines from games like roulette or blackjack, is that the probability of a poker machine is built in.
The original poker machines required players to pull a lever, which would spin gears and wheels inside. This caused three wheels on the front to spin, and the combination of symbols they landed on would determine whether or not you won. The likelihood of certain combinations occurring was engineered into the devices, but clever people also figured out how to manipulate them from the outside.
Today, poker machines are completely electronic. They are designed to tempt you over, then keep you playing. Sound effects and animations reward you for each push of a button, even when you lose. Much
like many computer games are designed to give you that feeling of needing ‘just one more turn … ’
In this lesson, students will explore how poker machines work, and what is meant by the term Return to Player (RTP) percentage. They will then run some simulations to determine how small betting amounts can lead to a large cumulative loss over time, and examine how reinvesting profits or wins from playing the poker machine back into the machine has the potential to lead to even greater losses over time.
Activity introduction
\\
Learning intentions
Students will:
• understand how repeated small losses over time can be significant
• understand that it is very easy to lose track of time while playing poker machines
• understand the concept of a Return to Player percentage.
Syllabus outcomes
• MAO-WM-01 develops understanding and fluency in mathematics through exploring and connecting mathematical concepts, choosing and applying mathematical techniques to solve problems, and communicating their thinking and reasoning coherently and clearly
• MA5-PRO-C-01 solves problems involving probabilities in multistage chance experiments and simulations.
The identified Life Skills outcome that relates to this activity is MALS-PRO-01 applies chance and probability to everyday events.
Capabilities and priorities
Literacy Numeracy
Information and communication technology (ICT) capability
Critical and creative thinking Ethical understanding
Teacher
worksheet
Teacher preparation
Gambling can be a high-risk activity and is a priority concern for young people. Therefore, before conducting the lesson on gambling, it is recommended that teachers read the Facilitator pack. The pack provides teachers and parents with essential information about gambling harm amongst young people and clarifies the nature of gambling-related behaviours and how to approach sensitive topics.
Learning intentions
Students will:
• understand how repeated small losses over time can be significant
• understand that it is very easy to lose track of time while playing poker machines
• understand the concept of a Return to Player percentage.
Success criteria
Students can:
• calculate the potential money lost while playing poker machines
• discuss the difference between money you have lost, and money you have gambled with.
Teacher content information
In the span of five months, from June to November 2020, NSW residents lost $2.17 billion to poker machines. They are an attractive, uncomplicated way to spend time gambling. You don’t need to learn any rules, or interact with
other players and a croupier. All you need to do is sit still and push a button.
Source: abc.net.au/news/2021-02-05/poker- machine-revenue-surges-in-nsw-and-western- sydney/13121448
Part A: Machines of chance
Work through this resource material in the following sequence:
Step 1
As a class, discuss what students already know about poker machines. Prompt their thinking by asking:
• What are they?
• How do they work?
• Where have you seen them?
• Are there different types?
Step 2
Watch: Gaming machines: Facts and myths.
Step 3
Hold a discussion:
• Imagine if the machine just showed you the numbers, instead of the reels with the graphics and the lights. Would this be as engaging to play?
• Sometimes the machine makes it look like you almost pulled off a jackpot. But remember that the machine can show you whatever it likes. Whether you won or not is again just dependent upon the numbers. So why would the machine show you being just one off a jackpot? What effect would this have on players?
• Remember that a 1 in 10 chance of winning does not mean that you are guaranteed to win if you play ten times. This is just the average over time. How might you feel if you played a poker machine for more than the average, and you didn’t experience a win? Would that affect your behaviour, playing more to chase that win? Would you believe that you are ‘due’ a win, based on the averages? Conversely, how would you feel if someone played one hit on the machine beside you and won the jackpot immediately?
Step 4
Give your class a basic lesson on how poker machines work. Essentially, you put in money which is converted into ‘credits’. You then decide how many credits to bet each game, and how many chances of winning you want (known as ‘lines’).
Part A: Machines of chance
Step 5
Ask students why the machines use credits instead of a monetary amount, and why casinos use poker chips instead of cash? It is psychologically less harmful to lose credits than it is to use money -another way gaming machines encourage people to keep gambling.
Step 6
Show your class the following image:
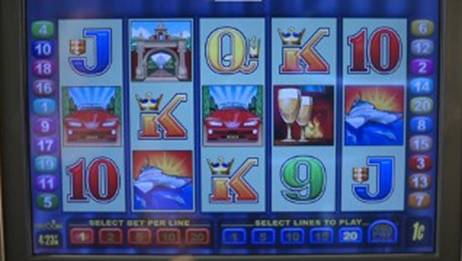
At
the bottom-left
are the
choices for
how many
credits you
can bet
per line
(1, 2,
5, 10,
20). At the bottom-right
we see
‘1c’. This
means the
cost of a
credit is one
cent.
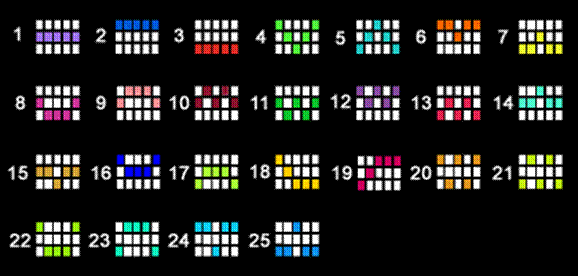
Between these, in blue, are the options for how many lines you wish to play. A line is a combination of symbols that need to match up in order to win. They are usually combinations of horizontal lines, diagonal lines, and zig-zag lines, such as this:
Part A: Machines of chance
This image is a good illustration of how the machine can display any other graphics it wants in the white (non-winning) squares to make it seem like you got close to a jackpot. The white squares could be blank for all the machine cares, it is only interested in the numbers in the highlighted spots.
Step 7
Explain to your class that poker machines are required by law to have a Return to Player (RTP) percentage of 85-90%. NSW has approximately 96,000 poker machines, with an across-the-board minimum RTP of 85%.
But what exactly does that mean? The RTP figure for a gaming machine is the amount of money the machine will return to winners based on how much is gambled over the life of the machine. A machine with a 90% RTP will return 90% of money gambled to winners, and keep the remaining 10% to itself.
Important: This does not mean that every player has to see a return of 90% of what they gamble. In fact, ten players in a row could see no return, so long as the machine pays out 90% over its lifetime, which could be millions or billions of spins. Many players could experience a loss so that one player experiences a jackpot payout.
Part B: Testing the payout
Step 1
Ask students to imagine they are playing a poker machine. This machine:
• charges five cents per credit
• has 20 lines
• has an RTP of 90%.
Step 2
You want to play all lines, with a single credit on each. Independently, students calculate how much each game or play will cost.
|
20 lines × 1 credit × $0.05 per credit |
= $1.00 per game. |
Step 3
A game can be completed every 4 seconds. Independently, students calculate how many games can be played:
• in a minute: 60 ÷ 4 = 15 games
• in an hour: 15 × 60 = 900 games
• in four hours: 900 × 4 = 3,600 games
Step 4
If this machine has a 90% RTP, how much would students expect to have won from this machine across their playing time?
First, students independently calculate how much they have spent on the machine:
|
3,600 × $1 per game |
= $3,600 |
Next, students independently calculate the 90% RTP :
|
90 |
|
|
|
= $3,240 |
|
100 |
|

So students should have made a massive profit, right?
Part B: Testing the payout
Well, no. There’s one factor we haven’t considered.
Step 5
Ask students to imagine they have originally withdrawn $360 from the ATM to play the poker machine with. How many games would this buy a player?
|
$360 ÷ $1 per game |
= 360 games |
Step 6
Ask students, if a player has only paid for 360 games, how did they manage to play 3,600 games in four hours?
Step 7
Explain to students that RTP isn’t based on how much of your own money you played with. It’s based on the total amount gambled with.
Any money of the 90% that was paid out during our four hour session on the poker machine has been reinvested back into the machine to play more games with.
Ten percent of $3600 is $360, and that is exactly how much the machine kept -leaving the player down
$360 from their bank account.
Part C: Simulation of a simulation
Step 1
Project Appendix A: Poker machine simulation spreadsheet (refer to excel spreadsheet) onto your whiteboard. Explain to your class that it allows you to select: the number of games you want to play, what you want to receive on a win, and the RTP percentage. The spreadsheet assumes you are spending $1 per game, so a payout of $5, for example, would mean you are risking $1 a game for a
$4 profit. The higher the payout, the lower the odds of winning.
Step 2
Share
the spreadsheet
for this
lesson with
your class
link to
the spreadsheet
and have
them experiment
with it for as long as you
like. Whenever they refresh the
sheet (F9 on
Windows,
 on
Mac) it will
generate a
new sequence
of numbers
and show
what their
projected wins
or losses
will be.
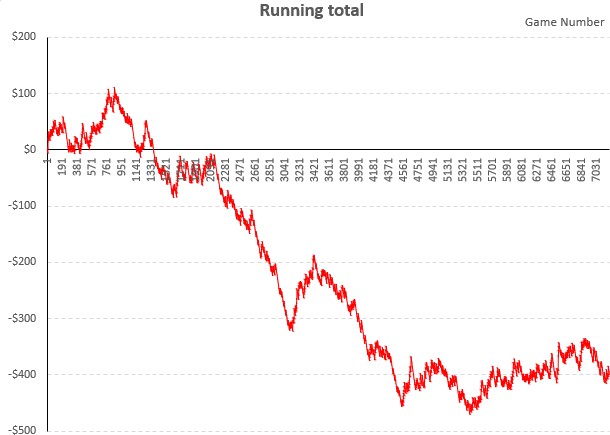
Remind students that you can play roughly 900 games an hour, so whilst these graphs look like they span a long time, it actually wouldn’t take much playing time to generate.
Part C:
Simulation of a
simulation
Reflection
Setting a bet limit is a great way to reduce the potential harms of gambling and avoid gambling more than you can afford to lose. Once you hit this limit, you’ll know not to put any more money in the machine.
Ask students to run one more simulation on the spreadsheet and pay attention to the lowest amount of money that the chart reaches.
Ask students to write a short paragraph reflecting on:
• How much of a loss it would take for them to walk away?
• On the other hand, would being up ‘only’ $10, $50, or $100 feel like enough of a win to be able to stop playing?
• Did the understanding that RTP is not per player, but over the life of the machine, and per amount gambled, not money each player invests, changed your attitude towards gambling on poker machines? Why or why not?

Teacher reflection

Appendix A:
Poker machine simulation spreadsheet
Please see the additional spreadsheet.
Filename: Maths_Stage05_Lesson03_AppendixA_Poker machine simulation spreadsheet.xlsx