Income, unemployment and education were found to be the most influencing factors of which major party that Australians vote for
The Conversation article You are what you vote: the social and demographic factors that influence your vote examined the relationships between electoral socio-demographic characteristics and two-party preference in the six Australian federal elections held between 2001 to 2016. Socio-demographic information was derived from the Australian Census, which occurs every five years. Since a Census is not directly available for each election, spatio-temporal imputation was employed to estimate Census data for the electorates at the time of each election. This accounts for both spatial and temporal changes in electoral characteristics between Censuses.
To capture any spatial heterogeneity, a spatial error model was estimated for each election, which incorporated a spatially structured random effect vector that can be thought of as the unobserved political climate in each electorate.
Over time, the impact of most socio-demographic characteristics that affect electoral two-party preference do not vary, with industry of work, incomes, household mobility and de facto relationships having strong effects in each of the six elections.
Education and unemployment are amongst those that have varying effects. It is also found that between 2004 and 2013, the spatial effect was insignificant, meaning that electorates voted effectively independently. All data featured in this study aas been contributed to the eechidna R package (available on CRAN).
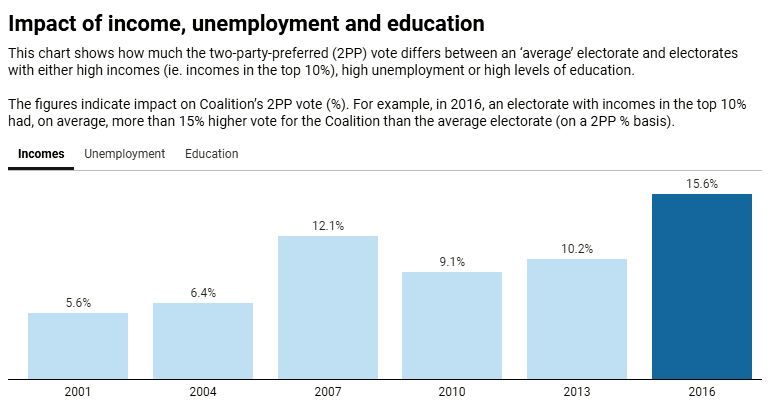
Income, unemployment and education were found to be the most influencing factors of which major party that Australians vote for.
Incomes include median family, household and personal incomes.
The analysis looks at more than 30 different socio-demographic characteristics from the Census. The ‘average’ electorate is constructed using the average value (either mean or median, across all electorates) for each of these.