Kelsey Wilkins
*The Reserve Bank has conducted a survey on bank fees each year since 1997. The results of the most recent survey suggest that banks’ fee income from both households and businesses rose moderately in 2014, predominantly as a result of balance sheet growth, rather than increases in fees on loans or deposits. Overall, developments in banks’ fee income followed similar patterns to 2013.
Overview
The Reserve Bank’s annual bank fee survey provides information on the fees earned by banks through their Australian operations.1 The focus of the survey is on fee income generated through the provision of loans, deposit services and payment services.
The 2014 survey included 16 institutions, capturing almost 90 per cent of the Australian banking sector by balance sheet size. Fees earned from operations outside of Australia and other fee income obtained through funds management and insurance operations are excluded from the survey. This article summarises the results from the latest survey, covering banks’ financial years ending in 2014.2
In 2014, domestic banking fee income grew by 2.8 per cent, to around $12 billion (Table 1). This reflected moderate increases in fees paid by both households and businesses, largely driven by volume growth rather than increases in unit fees. Deposit and loan fees as a ratio to outstanding values of deposits and assets were slightly lower than in the previous year (Graph 1).
1 The data from the survey are published in the Reserve Bank’s Statistical
Table C9, ‘Domestic Banking Fee Income’, and are subject to revision
on the advice of the participating banks.
2 Apart from Table 3, all data from the survey are based on individual
banks’ financial years, which differ between banks.
Banks’ Fee Income
Annual growth
0
15
%
0
15
%
Ratio to assets*
0.15
0.30
%
0.15
0.30
%
Lending fee income
Other non-deposit fee income
Ratio to deposits*
2002 2006 2010 2014
0.00
0.25
0.50
0.75
%
0.00
0.25
0.50
0.75
%
Deposit fee income
* Adjusted for breaks in series in 2002 due to a change in banks’
reporting; financial-year average assets and deposits have been used
Sources: APRA; RBA
Graph 1
* The author is from Domestic Markets Department.
Households
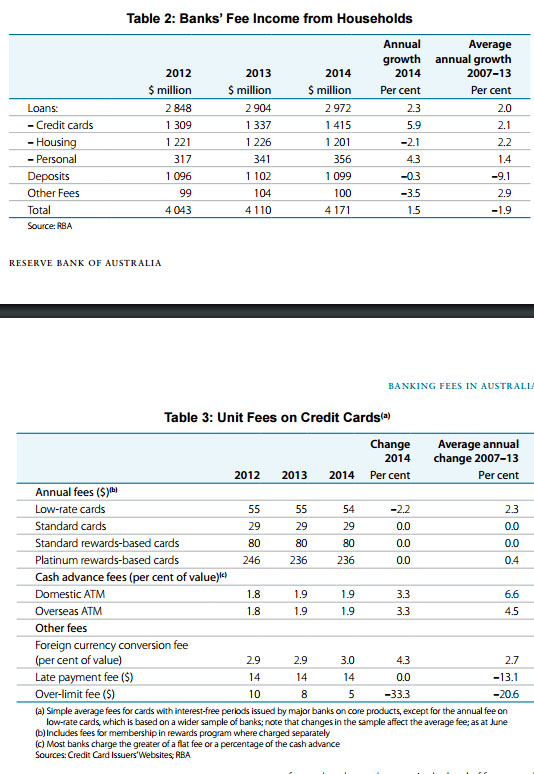
Banks’ fee income from households grew by 1.5 per cent in 2014, the second consecutive year of positive growth after earlier notable declines (Table 2).
Higher fee income reflected growth in credit card and personal lending fees, whereas fee income from housing lending and deposit accounts declined
(Graph 2).
Fee income from credit cards, which represents the largest component of fee income from households, increased by 5.9 per cent in 2014. Growth in fee income from credit cards was largely volume driven, relating to an increased number of cards on issue, as well as a higher frequency of foreign exchange conversion fees being incurred by customers. Annual fees charged on credit cards were little changed in 2014 (Table 3), while income from credit card exception fees declined for the fifth consecutive year in 2014 (Graph 3). This decline reflected a reduction in the number of instances of customers exceeding their credit limit or making late payments.
Table 1: Banks’ Fee Income
Households Businesses Total
Level Growth Level Growth Level Growth
$ million Per cent $ million Per cent $ million Per cent
2011 4 069 –5.6 6 830 4.8 10 899 0.7
2012 4 043 –0.6 7 298 6.9 11 341 4.1
2013 4 110 1.7 7 525 3.1 11 635 2.6
2014 4 171 1.5 7 791 3.5 11 962 2.8
Source: RBA
Table 2: Banks’ Fee Income from Households
2012 2013 2014
Annual
growth
2014
Average
annual growth
2007–13
$ million $ million $ million Per cent Per cent
Loans: 2 848 2 904 2 972 2.3 2.0
– Credit cards 1 309 1 337 1 415 5.9 2.1
– Housing 1 221 1 226 1 201 –2.1 2.2
– Personal 317 341 356 4.3 1.4
Deposits 1 096 1 102 1 099 –0.3 –9.1
Other Fees 99 104 100 –3.5 2.9
Total 4 043 4 110 4 171 1.5 –1.9
Source: RBA
Total
Housing loans
Deposits
Personal loans
Credit cards
Other
2002 2005 2008 2011 2014
-20
-10
0
10
20
%
-20
-10
0
10
20
%
Growth in Household Fee Income
Contribution by product
Source: RBA
 Graph 2
The increase in fee income from personal lending
was due to an increase in the number of loans
issued by banks in 2014. Most of the fees earned
from personal lending reflected higher instances of
late/early payment fees or establishment fees
associated with the increase in the volume of
lending.
Total deposit fee income decreased slightly in 2014,
following a modest increase in 2013. The decrease
in fees from household deposits was broad based
across most types of fees on deposit accounts.
In particular, account-servicing and transaction
fee income, as well as some fee income on other
non-transaction accounts (e.g. break fees on term
deposit accounts) declined notably. This decrease
was the result of fewer customers incurring these
fees rather than a decrease in the level of fees, as well
as customers shifting to lower fee products. However,
this was partially offset by an increase in income from
more frequent occurrences of exception fees (such
as overdrawn fees and dishonour fees) and foreign
exchange conversion fees being charged on deposit
accounts involving such transactions.
Total fee income from housing loans decreased
in 2014, with all components of housing loan fee
income decreasing, including exception fees. This
was due to a combination of fewer instances of
penalty fees being charged, and lower unit fees as
a result of strong competition between banks in the
home lending market. Similar to 2013, there was a
decrease in fee income from housing lending despite
strong growth in such lending. Several banks again
reported waiving fees on this type of lending for
some customers.
Businesses
Total fee income from businesses increased by
3.5 per cent in 2014 (Table 4). The increase in fee
income was evident for both large and small businesses (Graph 4).
Table 3: Unit Fees on Credit Cards
(a)Change
2014
Average annual
change 2007–13
2012 2013 2014
Per cent Per centAnnual fees ($)
(b)Low-rate cards 55 55 54 –2.2 2.3
Standard cards 29 29 29 0.0 0.0
Standard rewards-based cards 80 80 80 0.0 0.0
Platinum rewards-based cards 246 236 236 0.0 0.4
Cash advance fees (per cent of value)
(c)Domestic ATM 1.8 1.9 1.9 3.3 6.6
Overseas ATM 1.8 1.9 1.9 3.3 4.5
Other fees
Foreign currency conversion fee
(per cent of value) 2.9 2.9 3.0 4.3 2.7
Late payment fee ($) 14 14 14 0.0 –13.1
Over-limit fee ($) 10 8 5 –33.3 –20.6
(a) Simple average fees for cards with interest-free periods issued by major banks on core products, except for the annual fee on
low-rate cards, which is based on a wider sample of banks; note that changes in the sample affect the average fee; as at June
(b) Includes fees for membership in rewards program where charged separately
(c) Most banks charge the greater of a flat fee or a percentage of the cash advance
Sources: Credit Card Issuers’ Websites; RBA
Total
Deposits
Housing loans
Personal loans
Credit cards
2009 2010 2011 2012 2013 2014
-60
-40
-20
0
20
%
-60
-40
-20
0
20
%
Growth in Household Exception Fees
Contribution by product
Source: RBA
Graph 3
Table 4: Banks’ Fee Income from Businesses
2012 2013 2014
Annual
growth 2014
Average annual
growth 2007–13
$ million $ million $ million Per cent Per cent
Deposit accounts 623 603 590 –2.2 –5.3
– of which: exception fees 46 42 41 –1.1 na
Loans 3 142 3 243 3 334 2.8 11.7
– of which: exception fees 36 38 40 6.5 na
Merchant service fees 2 067 2 238 2 427 8.4 5.4
Bank bills 248 231 210 –9.2 21.2
Other 1 218 1 225 1 231 0.5 9.4
Total 7 298 7 525 7 791 3.5 7.3
– of which: exception fees 81 80 82 2.5 na
Source: RBA
Total
Deposits
Business loans
Merchant
Bills
Other
2002 2005 2008 2011 2014
-10
-5
0
5
10
15
%
-10
-5
0
5
10
15
%
Growth in Business Fee Income
Contribution by product
Source: RBA
Total
Small business
Large business
1998 2002 2006 2010 2014
-10
0
10
20
30
%
-10
0
10
20
30
%
Growth in Business Fee Income
Contribution by business type
Source: RBA
Graph 4 Graph 5
By product, the composition of the increase in fee income was very similar to the previous year (Graph 5).
Growth was driven by increases in merchant service fee income and, to a lesser extent, fee income from loans. Business fee income from deposit accounts and bank bills declined over 2014.
The increase in merchant service fees was mainly attributable to an increase in utilisation of business credit cards and a slight increase in some merchant unit fees. Merchant fee growth was approximately evenly spread across both small and large businesses.
The increase in loan fee income was mainly from an increase in account-servicing and exception fees from small businesses, which was a result of higher lending volumes (including through the introduction of some new lending products). Fee income from loans to large businesses increased slightly due to a higher volume of prepayment fees (though this was mostly offset by declines in other fee income from large businesses).
The increase in exception fee income from business loans was also mainly from small businesses, mostly in the form of honour fees (fees charged in association with banks honouring a payment despite insufficient funds in the holder’s account).
Fee income from business deposits continued to decline in 2014, with most of the decrease resulting from lower account-servicing and transaction fees, particularly for small businesses (small businesses account for the majority of business deposit fee income). The decrease was the result of a combination of lower volume growth and customers shifting to lower fee products.
R